The short answer, before anything else: auto-connect works. Since Chrome 144, Chrome DevTools MCP can attach your coding agent to the Chrome you're already using, logins, tabs, cookies, extensions and all, and setup takes about ten minutes. The catches: three well-documented ways to fail on first contact, and one structural limit no flag removes, agent and human share one window.
For logged-in tasks that shouldn't occupy your browser, that shared window is the part ego (lite) solves, free: every site you've signed into stays signed in, the agent inherits that state, and it works in its own Space with its own tabs, so your window stays yours.
The most-requested feature in Chrome DevTools MCP's tracker was never a debugging tool. It was issue #140: let the agent connect to the Chrome I'm already using, with my logins. This guide walks the whole path, pitfalls and limit included, in order.
How do you set up auto-connect?
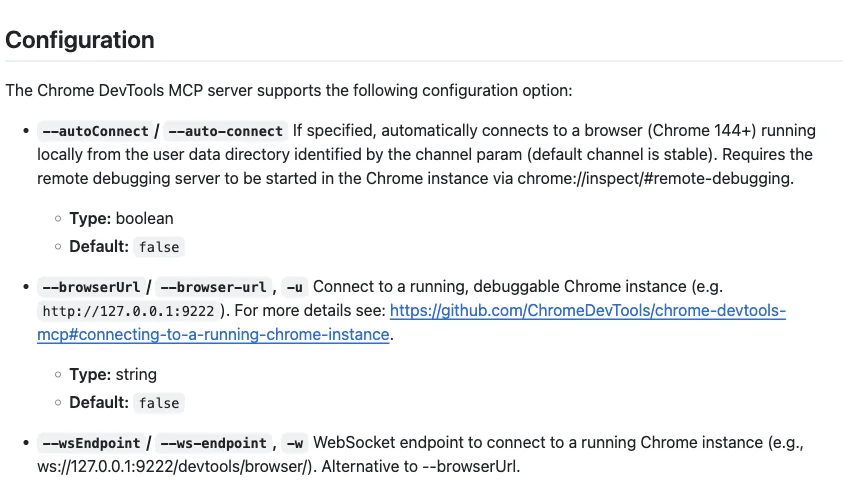
Three steps, all copy-paste. Prerequisite: Chrome 144 or newer on the Stable channel (Canary and Beta need the channel named in config), and any MCP client; the examples use Claude Code.
Step 1: enable remote debugging once. In your running Chrome, open chrome://inspect/#remote-debugging and switch remote debugging on. This is the bridge auto-connect rides; without it nothing else works.
Step 2: register the server with the flag.
claude mcp add chrome-devtools -- npx chrome-devtools-mcp@latest --autoConnectOr as the JSON block for Cursor and other clients:
{
  "mcpServers": {
    "chrome-devtools": {
      "command": "npx",
      "args": ["chrome-devtools-mcp@latest", "--autoConnect"]
    }
  }
}
Step 3: trigger and allow. Ask the agent to interact with your open Chrome ("take a screenshot of my current tab"). Chrome raises a permission dialog for the session; click Allow, and the agent is inside your live browser with your tabs, extensions, and application state.
Once you're connected, three first prompts that exercise what auto-connect is actually for:
"take a screenshot of my current tab and describe what you see" (proves the attachment), "start a performance trace, reload this page, and tell me what's delaying LCP" (the debugging payoff), and "reproduce the bug I just saw by clicking the export button, then read me the console errors with their sources" (live-session diagnosis, the thing no fresh-profile browser can do). If those work, you have the full toolkit.
What are the three pitfalls that break it?
Each of these shows up as "it doesn't connect" with no useful error. Check them in order.
1. The default-profile lock. Since Chrome 136, the debug port can't be enabled on your everyday profile; Chrome simply ignores the flag if you try. This is a deliberate security change (an open debug port on your main profile would let any local process drain cookies and session tokens). Auto-connect's permission-dialog flow is the sanctioned path around it; if you're on the older flag route, the fix is a dedicated --user-data-dir, covered in the next section.
2. A second Chrome instance. If any other Chrome process is running without the debug setup (a lingering background instance counts), connections fail or attach to the wrong window, and a debug-launched Chrome may close immediately. Quit every Chrome process before starting, then relaunch; on Apple Silicon, launching from a shell can also silently start Chrome under Rosetta, and prefixing arch -arm64 fixes it.
3. The port isn't actually answering. The browser side must be up before the agent starts. Verify independently: open http://127.0.0.1:9222 (flag route) and expect a JSON list of targets, or re-check chrome://inspect/#remote-debugging is still enabled (auto-connect route; the setting doesn't survive some updates). If the port answers and the agent still can't connect, restart the MCP server, not Chrome.
Extension conflicts deserve half a warning too: extensions that manage tabs or block scripts can interfere with the CDP session in ways that look like random flakiness. If connections drop mid-task, retry with your tab-manager extensions disabled before filing an issue.
How does auto-connect compare to the remote-debugging-port route?
Before auto-connect existed, the standard trick was launching Chrome with an explicit debug port and a dedicated profile directory:
/Applications/Google\ Chrome.app/Contents/MacOS/Google\ Chrome \
  --remote-debugging-port=9222 \
  --user-data-dir="$HOME/.chrome-debug-profile"

claude mcp add --transport stdio chrome-devtools \
  -- npx -y chrome-devtools-mcp@latest \
  --browserUrl=http://127.0.0.1:9222
The trade is clean. Auto-connect gives you your real profile (true logins, real extensions, live state) with a per-session permission dialog; the flag route gives you a separate profile you log into once, which persists across restarts, needs no dialog, and, as the practitioners documenting it note, stays more reliable in sandboxed environments. The flag route is also your only option below Chrome 144.
Side by side, so you can pick in one glance:
| Property | Auto-connect | Debug port + dedicated profile |
|---|---|---|
| Whose logins | Your real, everyday profile | A second profile you sign into once |
| Chrome version | 144+ | Any recent Chrome |
| Per-session friction | Permission dialog each session | None once launched with the flags |
| Best for | Debugging the app state you're looking at right now | Repeatable authenticated testing, sandboxed or CI-adjacent setups |
Sensible hygiene applies to both: keep banking and personal email out of any profile an agent can reach, and close Chrome when you're done so the port closes with it.
What limit does no flag remove?
After all the setup succeeds, one fact remains: the agent is working in the browser you're using. Same window, same tabs, same focus. While it navigates, that tab is occupied; while you type, you're in its way. Auto-connect was built for debugging sessions, where taking turns with the agent is natural. For background tasks ("pull the numbers from three dashboards while I write"), turn-taking is the whole problem.
That's the slot ego (lite) fills. It's a free browser built for sharing your logged-in browser state with AI agents like Claude Code and Codex: every site you've signed into stays signed in and the agent inherits that state, but it works in its own Space, an isolated workspace with its own tabs, so your window stays yours and multiple tasks run in parallel without colliding.
Any agent that can run a shell command drives it through the ego-browser skill; no manual debug-port setup, no chrome://inspect step, no per-session permission dialog: the same CDP control ships built in, pointed at a browser built to be driven.
The honest division: keep Chrome DevTools MCP for what it's uniquely good at (performance traces, memory snapshots, debugging your live session), and hand the daily logged-in task work to a browser that doesn't need your window to do it.
Download ego (lite) for Mac or read how Chrome DevTools MCP and Playwright MCP divide the work. Both free.
FAQ
How do I add Chrome DevTools MCP to Claude Code?
claude mcp add chrome-devtools -- npx chrome-devtools-mcp@latest, appending --autoConnect if you want it attached to your live browser. Verify with /mcp inside Claude Code, then ask for a screenshot of the current tab.
Does auto-connect work with Cursor and other agents?
Yes; it's a property of the MCP server, not the client. Any MCP client that can run the npx command works, with the same Chrome 144+ and remote-debugging prerequisites on the browser side.
Is connecting an agent to my logged-in browser safe?
The mechanism is safer than the old open-port approach (per-session permission dialogs, local-only server, no data sent to Google), but the grant is broad: cookies, storage, and every open tab. Treat it like lending your unlocked laptop: fine for a trusted agent on a bounded task, wrong for anything touching banking or primary email.
Can I keep browsing while the agent uses my Chrome?
Technically yes, practically no. You share one window and one focus: when the agent navigates or clicks, it does so in the tabs you're looking at, and your typing can land mid-action. Auto-connect sessions work best treated like pair programming, one driver at a time, which is fine for debugging and wrong for background chores.
Can the agent work in my logged-in sites without taking my window?
Not through Chrome DevTools MCP; shared window is inherent to its design. That combination (inherited logins plus an independent window) is exactly what ego (lite)'s Spaces provide, and it's free.