
The best MCP server bug is the one you catch before a user ever sees it. MCP Inspector is the reference tool for that job. It lets you check whether the server connects, exposes the right tools, accepts real arguments, returns the expected payload, and fails in a way your client can understand.
A good pre-deploy check should move through those layers in order: handshake, tool surface, schema, behavior, failure paths, auth boundaries, logging, and finally CI. For most of that, MCP Inspector is enough. If the server ultimately depends on a real signed-in browser, ego (lite) fits at the last step by giving the agent a visible Chromium Space with the existing login state and human takeover when needed.
The commands below follow the official Inspector documentation and repository smoke-testing guide checked on September 20, 2026. The web client captures in this guide come from a real first-party run of the pinned @2.5.0 launcher against a local fixture, and the exit-code cross-check was captured in a visible ego (lite) Space. Pin exact versions and verify each assertion against your own server before turning it into a deployment gate.
What should you test on an MCP server before deployment?
An MCP server has more surfaces than most test suites cover. Seven checks, run in this order, catch the failures that otherwise reach production:
| Layer | What you are proving | Where it runs |
|---|---|---|
| Connection | The server starts and completes an MCP handshake | The initialize probe in the Inspector |
| Surface | The tools, resources, and prompts match what the release notes claim | tools/list, resources/list, and prompts/list |
| Schema | A real client will accept the tool schemas | tools/list --strict |
| Behavior | A representative call returns the payload you expect | tools/call plus an assertion |
| Failure paths | Timeouts, auth challenges, and refusals fail loudly and correctly | Exit codes and --connect-timeout |
| Boundaries | Tokens, scopes, and planted instructions cannot go further than intended | An isolated auth store and fixture servers |
| Gate | Every commit re-runs the same assertions | A CI job with a pinned Inspector version |
The rest of this guide expands each row. One rule keeps the list honest: a check that only prints a result is not a test. A test asserts a value and exits non-zero when the assertion stops holding.
How do you probe an MCP server with MCP Inspector?
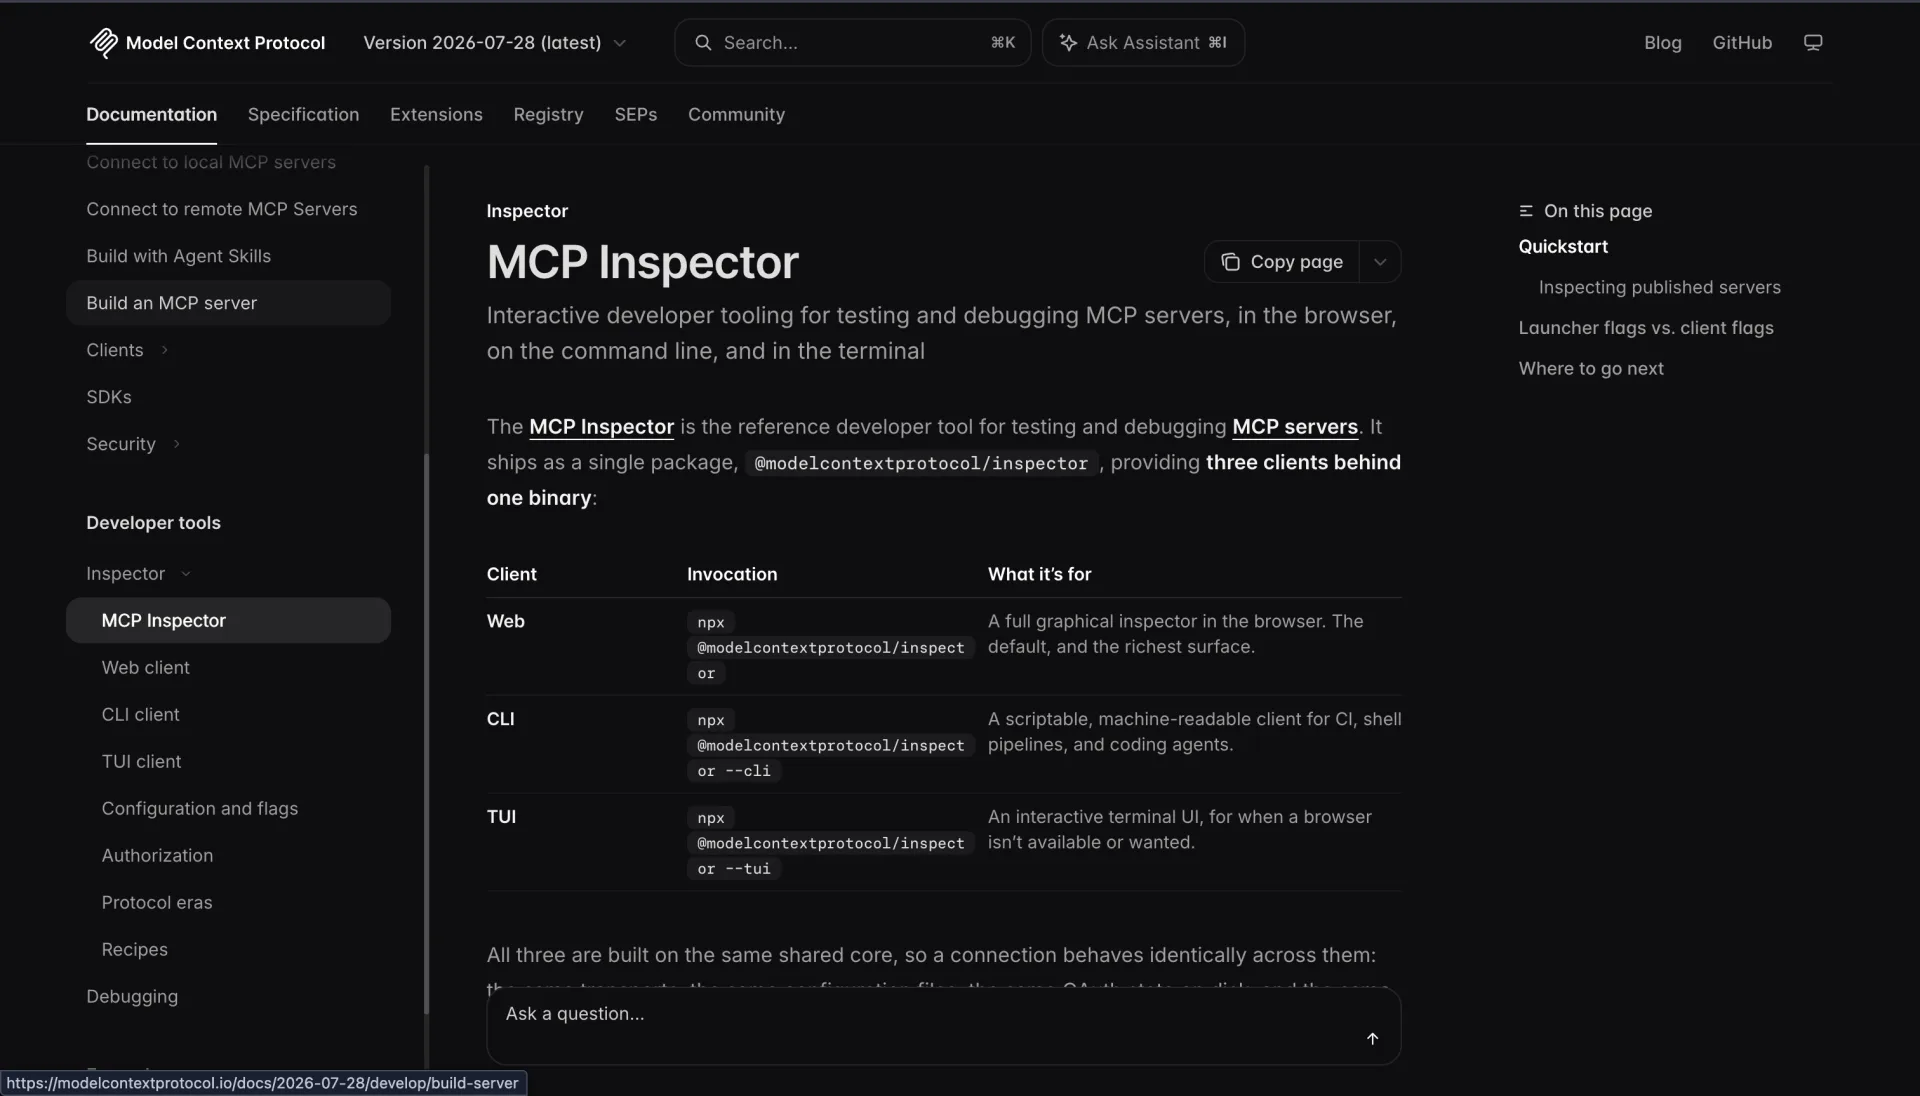
MCP Inspector ships as a single package, @modelcontextprotocol/inspector, and provides three clients behind one binary: the web UI (the default), a scriptable CLI, and an interactive terminal UI. All three require Node 22.19.0 or newer and run through npx with no installation.
npx @modelcontextprotocol/inspector node path/to/server/index.js
npx @modelcontextprotocol/inspector --cli node path/to/server/index.js --method tools/list
npx @modelcontextprotocol/inspector --tui node path/to/server/index.js
For a remote server, point the Inspector at the URL instead of a command: --server-url https://api.example.com/mcp --transport http for Streamable HTTP, or --transport sse for SSE. Read the server's own README first, because every server takes different commands and arguments, and that is where the launch command comes from.
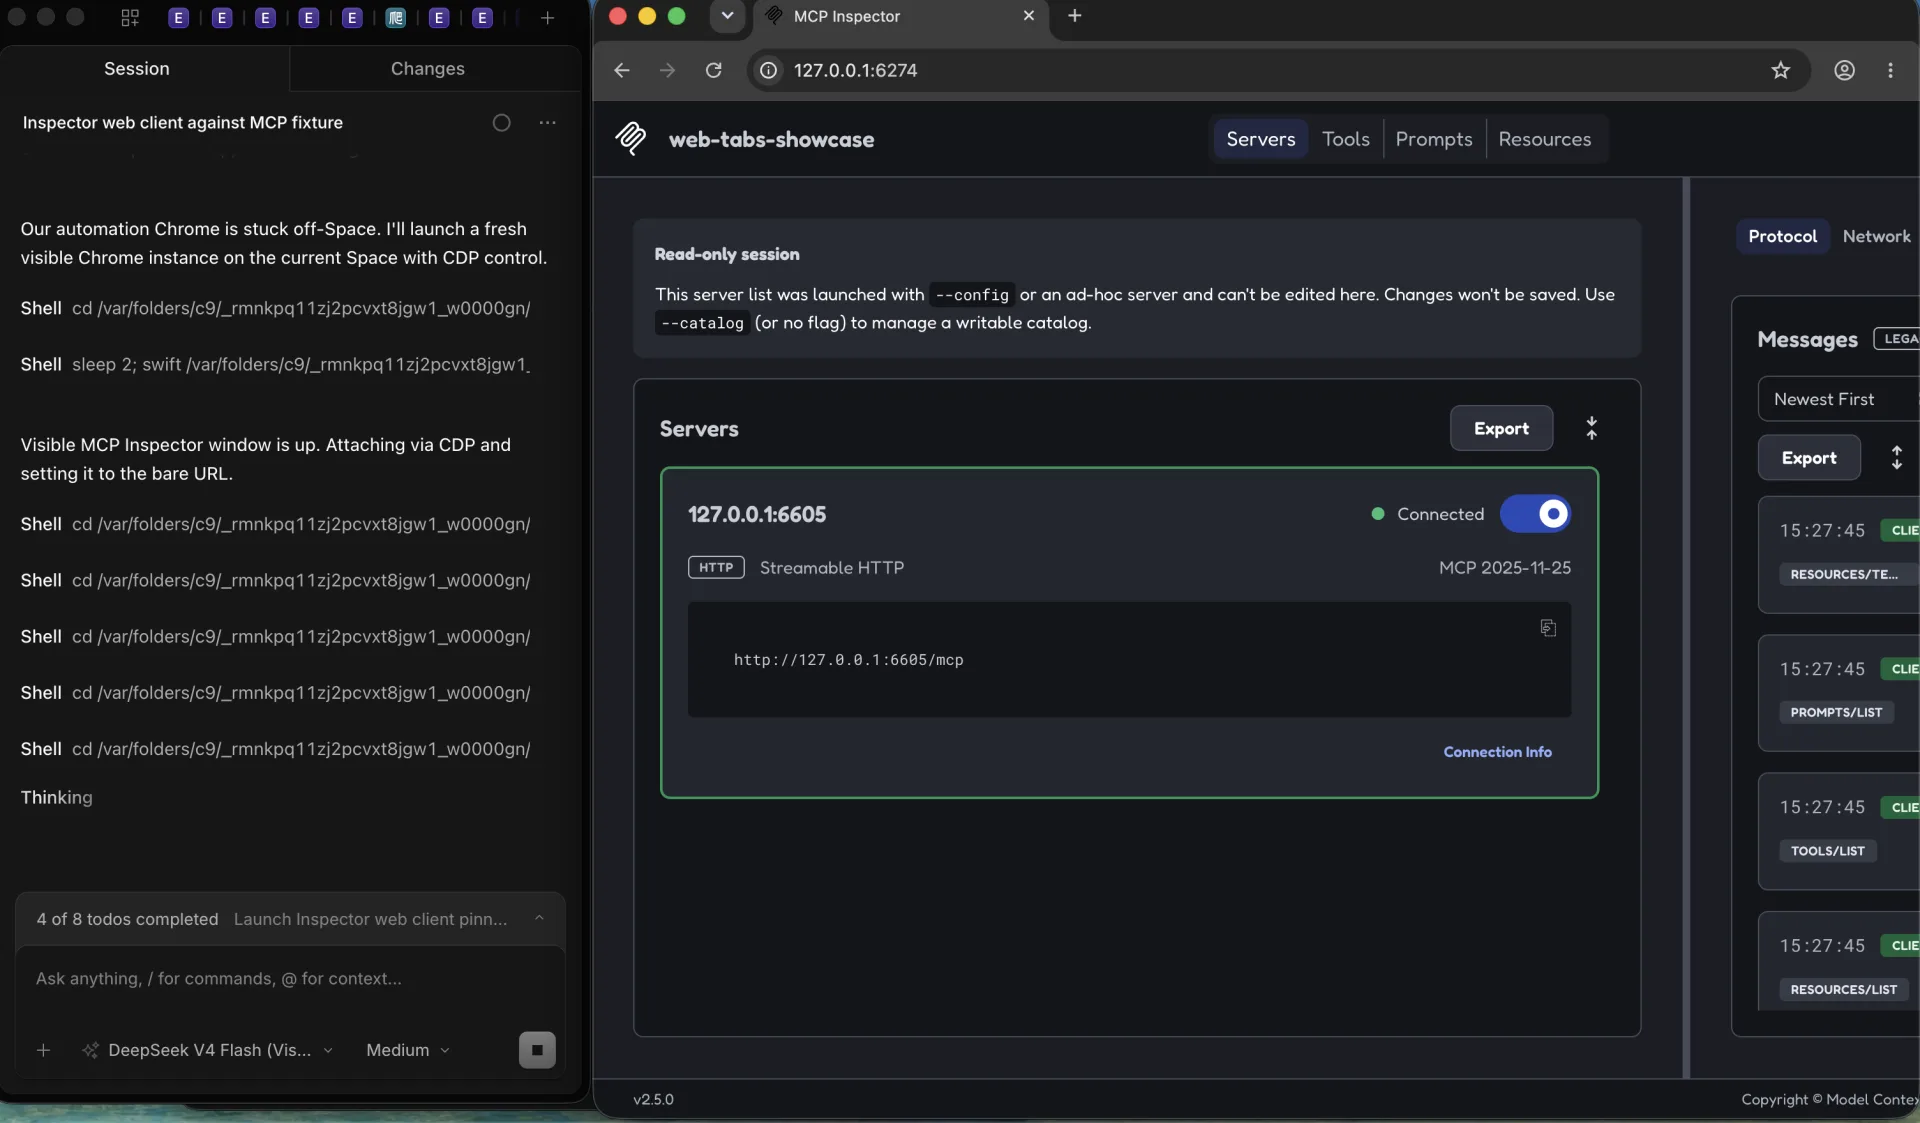
The web client shows tabs only for the capabilities the server actually reports. Tools renders each input schema as a form and shows the result with structured content; Prompts previews generated messages; Resources browses, reads, and subscribes; Protocol keeps the JSON-RPC transcript; Logs shows server notifications. HTTP and SSE servers also get a Network tab with status, headers, and bodies, while stdio servers get a Console tab with the process's stderr. The two never appear together, and secrets are masked in those views.
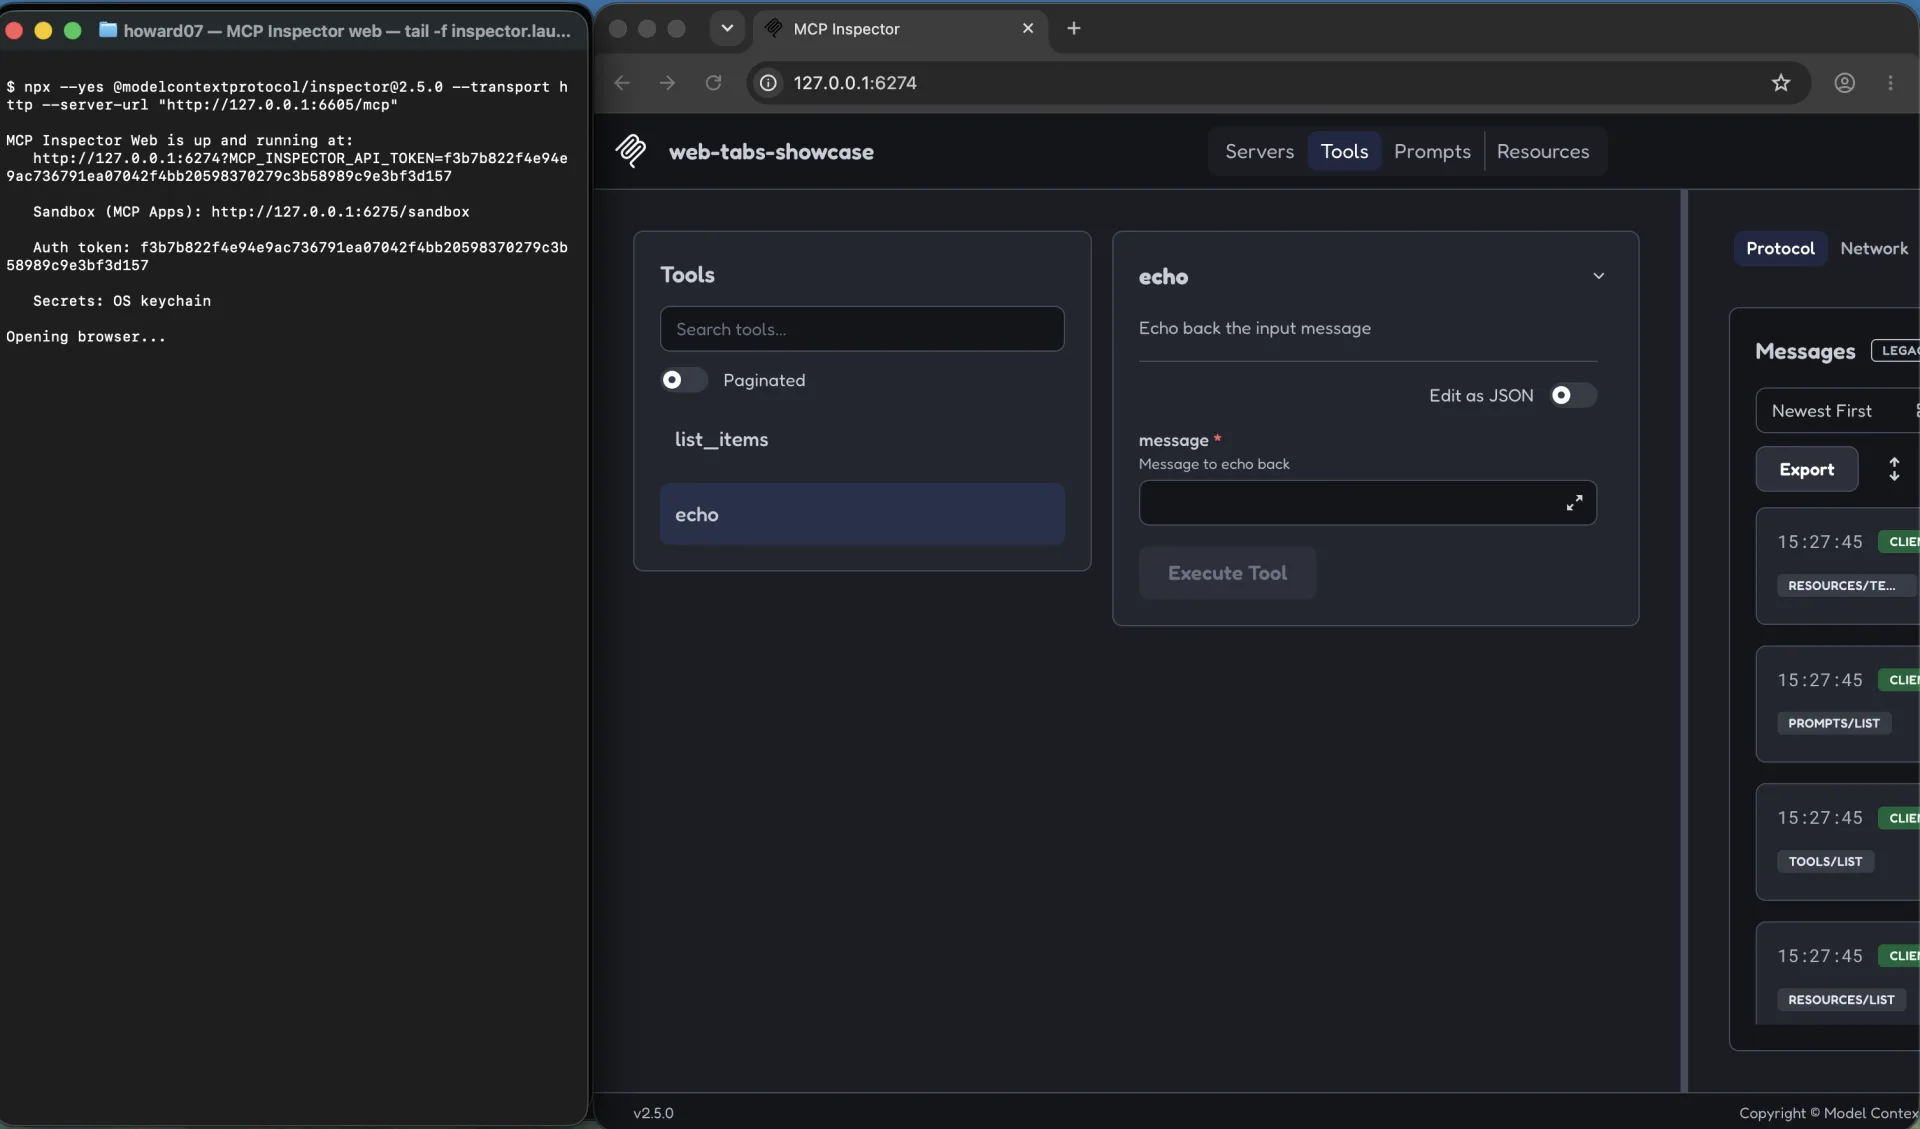
Manual probing is where you learn the server's real personality before automating it. Call a tool with realistic arguments, watch the Protocol transcript for the exact request and response, and write down the values you will assert later. The CLI then turns the same connection into a script: --method initialize is a connect-only probe that prints serverInfo, protocolVersion, capabilities, and instructions, and exits without invoking anything. That is the cheapest is-it-alive-and-speaking-MCP assertion you can put in a pipeline.
One stdio subtlety: if the server takes flags of its own, separate them with a double dash. Under --cli, everything before the separator is the target command and everything after it is the Inspector's own options.
How do you validate tool schemas before rollout?
A tool schema can be valid JSON Schema and still be rejected by the client your server is meant to serve. Schema portability deserves its own test. List what clients will actually see, then check it strictly:
npx @modelcontextprotocol/inspector --cli node build/index.js --method tools/list
npx @modelcontextprotocol/inspector --cli node build/index.js --method tools/list --strict
The strict pass names each portability problem with the path, the issue, and a concrete fix. The CLI documentation on modelcontextprotocol.io maps exit codes 0 through 5; the repository's smoke-testing guide adds exit 6 for an error-severity strict finding, and notes that warnings are reported without changing the exit code.
In a JSON pipeline, read the structured copy. With --format json, the findings land in a schemaFindings array on stdout, grouped per tool, alongside the human report on stderr:
npx @modelcontextprotocol/inspector --cli node build/index.js \
  --method tools/list --strict --format json \
  | jq -e '[.schemaFindings[]?.findings[]? | select(.severity=="error")] | length == 0' > /dev/null
Two details from the repository guide matter when you script that. The schemaFindings key is absent when there are no findings, which is why the filter uses the optional forms. And the strict pass is worth running in CI on any server whose schemas are generated, because a dependency bump can change the emitted shape without anyone editing a schema.
Arguments deserve the same care. --tool-arg key=value parses each value as JSON when it can, so a numeric-looking value can reach the server as a number; --tool-args-json passes the whole object verbatim. Prefer the JSON form for anything typed, such as a ZIP code or an order ID, and keep the argument check in the same test run as the schema check.
What do contract and acceptance tests look like?
A contract test is the smallest test that would fail if the server stopped doing the one thing your product depends on. The repository's smoke-testing guide defines the shape: connect, prove it speaks MCP, prove the one or two things you depend on still work, and fail the job when they do not. It is deliberately not a conformance suite.
Four steps, in order:
- Handshake: assert that initialize returns a protocol version.
- Surface: assert that every tool you depend on appears in tools/list, and the same for resources and prompts.
- Behavior: call one representative tool that is safe to call repeatedly, meaning read-only, idempotent, and cheap. A smoke test runs on every commit, so it is not the place for the tool that sends email.
- Payload: assert a field in structured content or a substring in text content, not just a zero exit code.
npx --yes @modelcontextprotocol/inspector@2.5.0 --cli \
  --transport http --server-url "$SERVER_URL" \
  --connect-timeout 10000 --stored-auth-only --format json \
  --method initialize | jq -e '.result.protocolVersion' > /dev/null
jq -e sets its own exit status from the output, so a missing field or a false assertion fails the step without extra shell. Keep stdout and stderr separate, because stdout carries the result and stderr carries diagnostics, and merging them into jq breaks the parse. Pin the exact version too: npx resolves the latest release each time it runs, so the same commit can run against a different Inspector on a later day.
Playwright belongs next to this section only if the server's job includes a browser. Playwright's testing documentation describes pages as isolated between tests because each test gets a fresh browser context, equivalent to a new browser profile. That isolation is a feature for regression tests, and it is exactly why a passing Playwright suite does not prove login-state behavior. If the server's value depends on an existing signed-in session, the end-to-end check has to happen somewhere else, which the CI section returns to.
How do you test error, timeout, and retry paths?
Error behavior is part of the API. The Inspector CLI gives it a stable vocabulary: every non-zero exit maps to a failure class, and the CLI also writes a single-line JSON error envelope to stderr.
| Exit | Meaning |
|---|---|
| 0 | Success |
| 1 | Usage or unexpected error |
| 2 | No MCP App found on the tool, reported by an --app-info probe |
| 3 | The server requires authentication, such as a 401, 403, or OAuth challenge |
| 4 | The server is unreachable: DNS, connection refused, or timeout |
| 5 | A tool error: tools/call returned isError true, or the tool was not found |
| 6 | An error-severity strict schema finding, per the repository's smoke-testing guide |
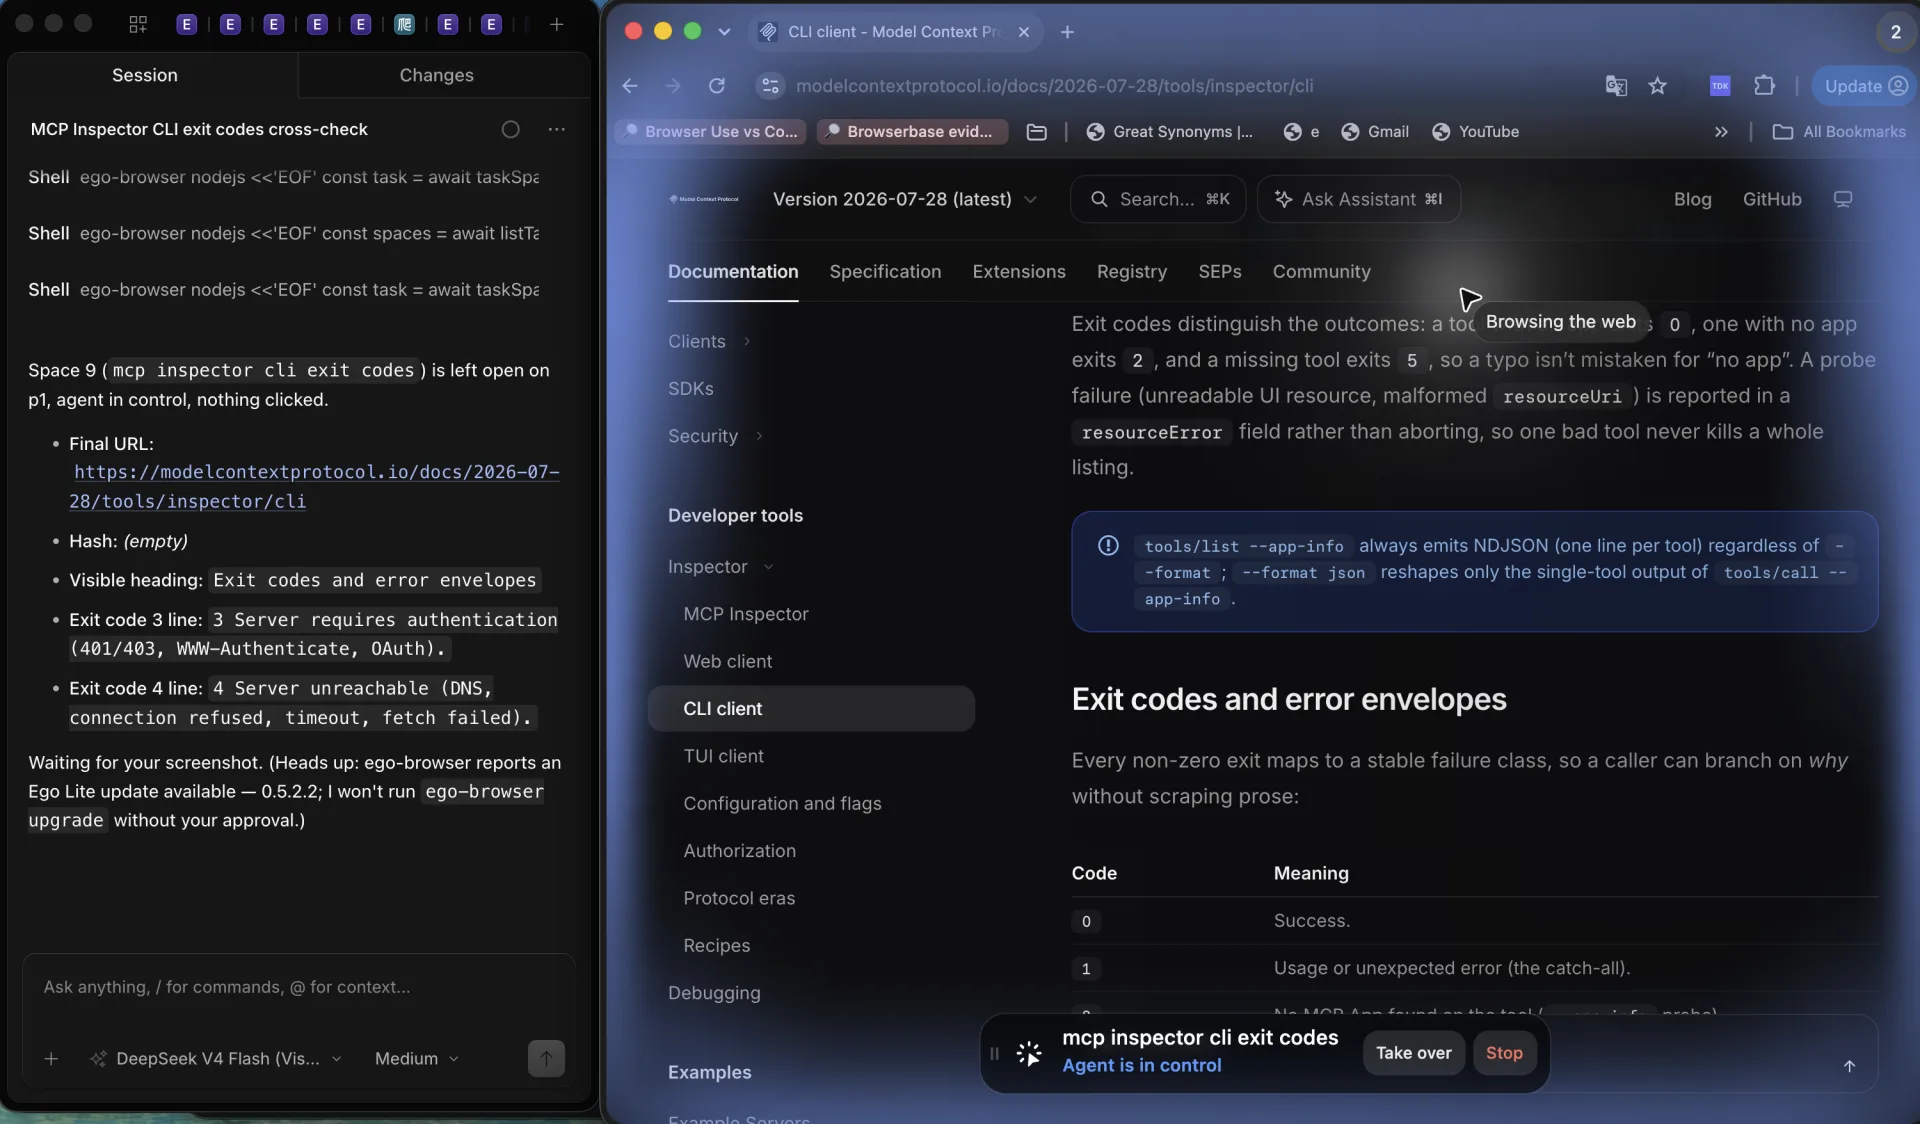
Three practices turn those codes into coverage. First, bound the connect. --connect-timeout defaults to 15000 milliseconds for ad-hoc targets and 0 disables it, and a CI job should never inherit a disabled timeout, because a black-holed host would hang the runner until the job's own limit kills it.
Second, assert refusals. If the server is supposed to reject a path outside its root, run that call in the test and require the failure. Because isError true exits 5, a check that only asks did it fail cannot distinguish a refusal from a crash; capture the status and require exactly 5 when that distinction matters.
Third, capture the status before jq. pipefail reports the rightmost non-zero status, so a tool call that exits 5 while the assertion also fails surfaces as 1, and the failure class is lost. For tools with side effects, decide the retry contract in the test rather than in the runner: one deliberate attempt, then stop and report, never a silent retry loop.
How do you test auth, permission, and injection boundaries?
Two boundary questions decide whether a passing test means anything: what authority does the server have, and what happens when untrusted content tries to redirect it?
Auth: prove the challenge, not the happy path. In CI, the interactive OAuth flow is wrong by default: the CLI can open a browser and wait on a loopback callback for up to fifteen minutes. --stored-auth-only never starts interactive OAuth, never opens a browser, and fails immediately when the store has nothing that fits. Isolate the store per job with MCP_STORAGE_DIR and MCP_INSPECTOR_OAUTH_STATE_PATH, in that precedence order. Then remember the subtle part: the flag is a no-op against a server that never challenges, so a green run is not evidence that authentication happened. To assert that it did, run once without a usable token in an isolated store and require exit 3.
The cleanest CI credential is usually not OAuth at all: pass a static Authorization header from your secret store. Never embed a credential in a server URL or in stdio arguments, because the CLI does not scrub those.
Permission boundaries. A server must not accept tokens that were not issued for it. The MCP security best practices document forbids token passthrough and requires audience validation, because accepting foreign tokens breaks the OAuth boundary and turns the server into a relay for someone else's credentials. The same document asks for scope minimization: start with the smallest scope set, elevate only when an operation requires it, and avoid omnibus scopes. State handles need the same discipline, since possession of a handle must never be treated as authentication; handles should be bound server-side to the authenticated user.
Prompt injection and tool abuse. Plant a harmless conflicting instruction in a fixture the server must process, then verify the output against the source document, not against the server's summary. A server that obeys text inside a file over the instructions it was given fails that checkpoint. Add a coarse secret scan on captured output, because a credential echoed back in a tool result or an error message is a real leak class. On the network side, remember that a malicious server can point OAuth metadata at internal addresses and cloud metadata endpoints, so a client deployed on a server should require HTTPS, block private address ranges, and validate redirect targets. Finally, treat installing a local server as code execution: a one-click configuration flow should show the exact command, require explicit approval, and sandbox what it spawns.
What should you log during a test run?
Logging is what you have left when a check fails at 2 a.m. The transport decides where logs go. A local stdio server should log to stderr, which the host application captures automatically, and should not log to stdout, because that would interfere with protocol operation. A server on Streamable HTTP gets no such capture: stderr is not collected by the client, so use your own aggregation or OpenTelemetry, plus standard HTTP tooling to inspect requests and responses. Protocol-level logging through notifications/message is deprecated as of protocol version 2026-07-28, so do not build new logging on it.
Record the events an incident review will ask for: startup steps, resource access, tool execution, error conditions, and performance metrics, each with timestamps and request IDs where the transport provides them. Sanitize before you store, so no credentials, personal data, or raw session state end up in a log, a ticket, or a screenshot.
On the client side, the Inspector is your recorder. The Protocol tab keeps the JSON-RPC transcript, the Network tab keeps the HTTP view for HTTP and SSE servers, and the Console tab keeps the stdio server's stderr; entries can be cleared or exported. Add the CLI's own output to the evidence: the JSON result on stdout and the one-line error envelope on stderr, saved with the run. When you review a failure, read the raw exchange rather than the server's summary of it.
One more log check belongs in the suite: protocol compatibility. The debugging guide suggests calling server/discover to see which protocol versions the server supports, since an unsupported-version error lists them in its data field, and it notes that every request must carry the protocol version and client capabilities metadata. A request missing either is rejected as invalid params.
How do you gate a deploy in CI?
The gate is the same smoke script you ran by hand, with a pinned Inspector version, a least-privilege runner, and a failure class you can act on:
smoke:
  runs-on: ubuntu-latest
  permissions:
    contents: read
  steps:
    - uses: actions/checkout@v7
      with:
        persist-credentials: false
    - uses: actions/setup-node@v7
      with:
        node-version: "22.x"
    - run: bash smoke.sh
      env:
        SERVER_URL: ${{ vars.MCP_SERVER_URL }}
        MCP_TOKEN: ${{ secrets.MCP_TOKEN }}
Three habits make that job trustworthy. Pin the Inspector and pass --yes, so an unattended runner never hangs on a first-run prompt. Keep the permissions block minimal and persist-credentials false, because the job downloads and runs a package from npm. And report the failure class, capturing the CLI's exit code before any jq in the pipeline, since pipefail reports the rightmost non-zero status and the class is otherwise lost.
Where the gate ends, the last mile begins. The Inspector proves protocol, schema, tool calls, and failure classes. It does not reproduce a rendered UI, and it cannot hand a browser-driving server a real signed-in session. Browser-facing MCP servers are exactly that case: the server's quality depends on the browser state it inherits. For that final check, ego (lite) is the browser to run it in. It is a local Chromium that carries your existing logins, and each agent task works in its own visible Space, so you can watch the run, complete a login or verification prompt yourself, and let the agent continue in the same session. A concrete version of the check: connect the agent with the ego-browser skill, point it at the server's end-to-end scenario on a signed-in site, and take over during the run when the site asks for a human.
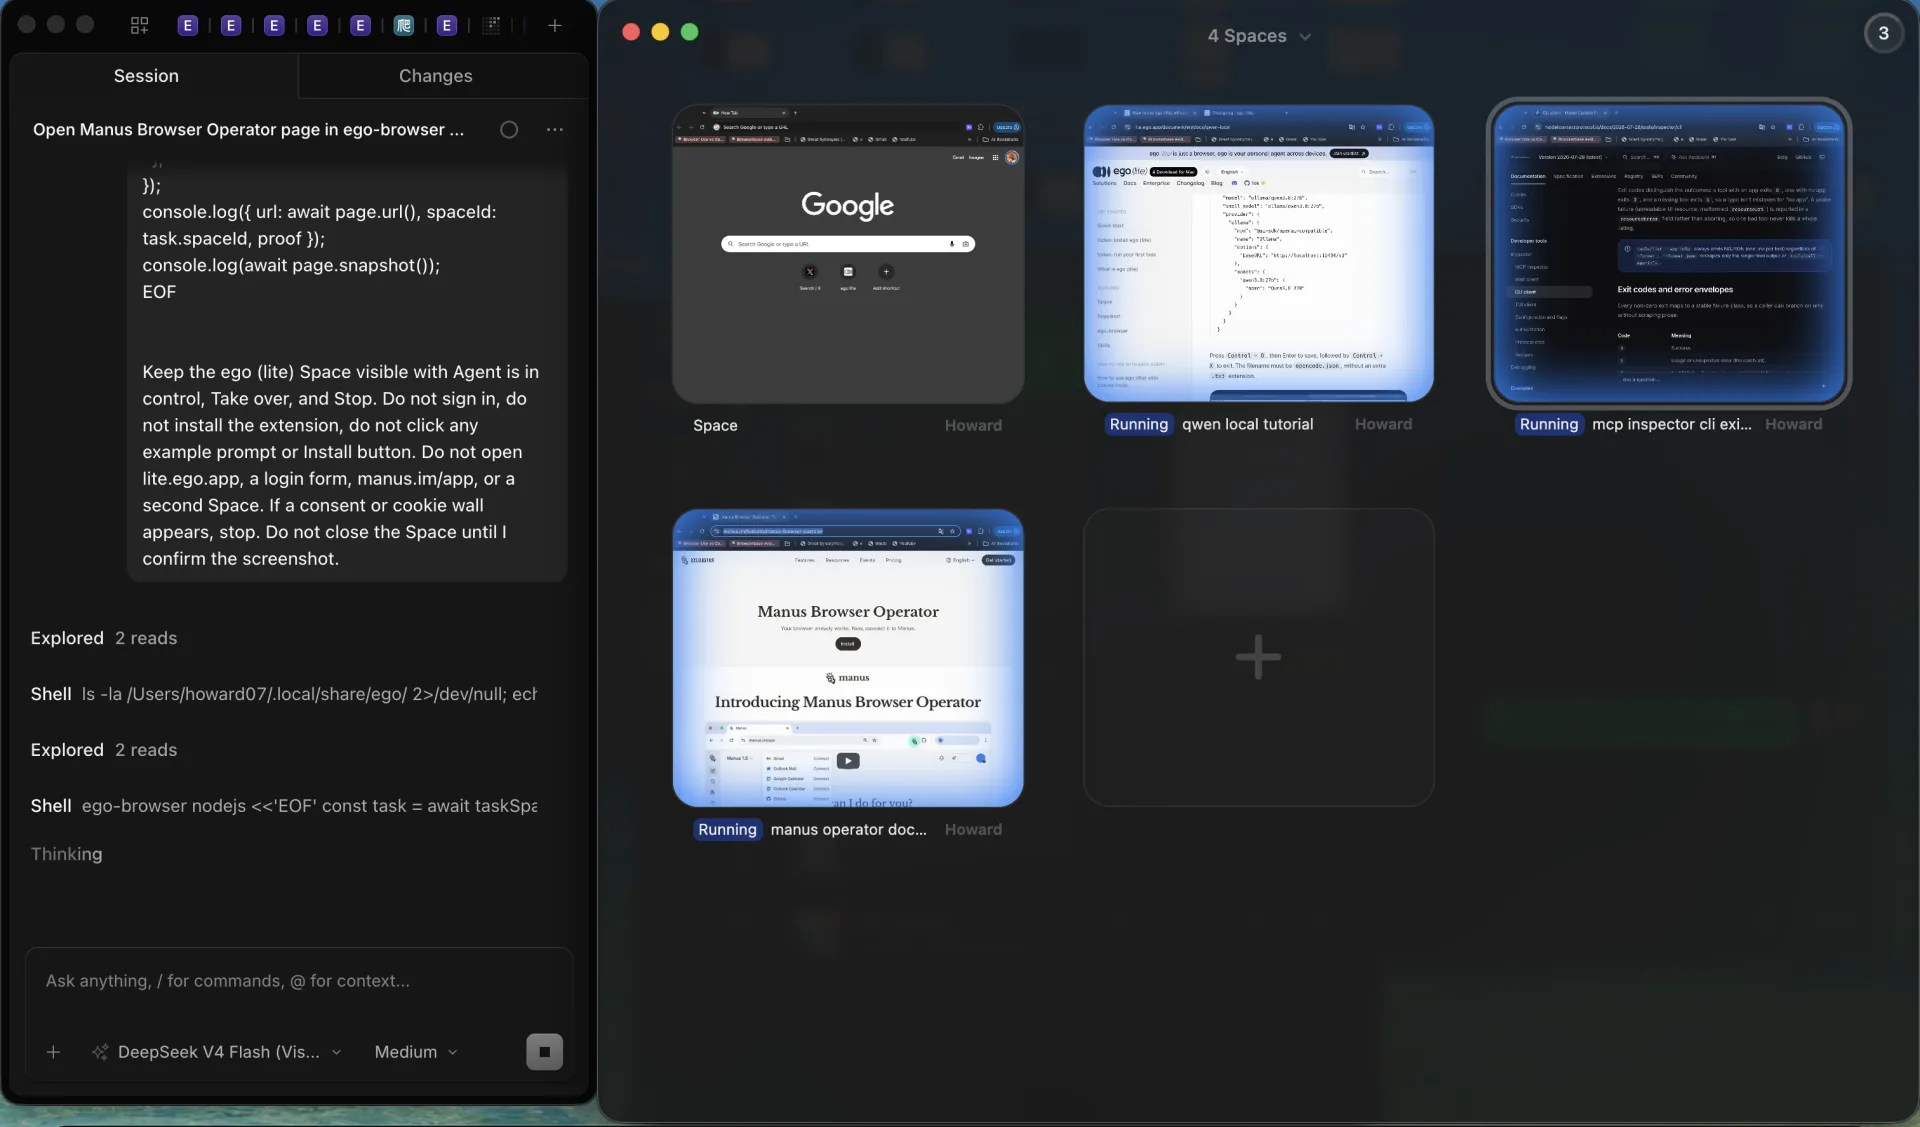
Be explicit about when ego (lite) is not the answer. For the protocol handshake, tool listing, schema validation, stdio servers, and the CI gate itself, the Inspector alone is enough, and adding a real browser there would only make the test slower and less deterministic. Use ego (lite) only when the server's correctness depends on state a fresh profile cannot produce: an existing login, a visible execution you want to review, or a handoff the agent cannot complete alone.
For the browser-driven case, set that end-to-end Space up first: see how ego (lite) compares with the Playwright MCP route, feature by feature, or download ego (lite) for Mac.
FAQ
What is the best tool to test an MCP server before deployment?
MCP Inspector is the reference developer tool for testing and debugging MCP servers, and the MCP debugging guide calls it the first stop. It ships as one package with a web UI, a CLI for scripts and CI, and a terminal UI for environments without a browser, and it needs Node 22.19.0 or newer.
Can MCP Inspector run in CI without a browser?
Yes. The CLI client is built for exactly that: one process per assertion, a machine-readable result with --format json, and stable exit codes that distinguish auth, unreachable, and tool errors. Add --stored-auth-only so a job fails fast instead of waiting on an interactive OAuth callback, and pin an exact version because npx otherwise resolves the latest release.
How do I validate MCP tool schemas?
List the tools, then check them strictly. tools/list shows what clients will see, and the strict pass reports portability findings with the path, issue, and a suggested fix. In JSON output the findings arrive in a schemaFindings array, and an error-severity finding is documented to exit 6 in the repository's smoke-testing guide.
How do I test MCP server error and timeout handling?
Bound the connect with --connect-timeout, then assert the failure you expect. A refusal should fail with exit 5 rather than pass by accident, an unreachable server should exit 4, and an auth challenge should exit 3. Capture the CLI's exit code before any jq in the pipeline, because pipefail reports the rightmost non-zero status and the failure class is otherwise lost.
How do I check prompt injection and tool abuse in an MCP server?
Plant a harmless conflicting instruction in a file the server must process, then verify the output against the source document instead of the server's summary. Add a coarse secret scan over captured tool output and error messages, and assert that out-of-scope requests are refused rather than only that the happy path works. The MCP security best practices document covers the surrounding controls: token passthrough is forbidden, scopes should start minimal, and a local server should be treated as code you are choosing to execute.
Do I need ego (lite) to test an MCP server?
No for protocol, schema, stdio, and CI checks; that is what MCP Inspector is for. ego (lite) matters only for the last mile where the server's correctness depends on a real signed-in browser: a local Chromium Space with your existing logins, visible execution you can watch, and human takeover for a login or verification step. Use it when a fresh browser profile cannot reproduce the state the server needs.