A server name in Codex settings is the beginning of a browser setup. The useful finish is an actual tool call against the intended tab, followed by a result you can check.
Chrome DevTools MCP with Codex connects the coding agent to Chrome inspection and automation tools so it can investigate a page and verify changes. Codex supplies the reasoning and client configuration; the MCP server supplies browser tools. Confirm both sides before debugging the website.
This guide follows official configuration documentation checked October 14, 2026 and includes supplied screenshots from two independent TodoMVC runs that day. The DevTools run used a Codex shell stdio client because the active chat did not expose the newly configured server as native tools; the ego (lite) run used its installed browser helper.
How do you install Chrome DevTools MCP with Codex?
Register the official Chrome DevTools MCP package as a local stdio server in Codex. Begin with a supported current Node.js LTS, npm and Chrome; check the installed package requirements when choosing a pinned release.
The Chrome client configuration guide documents the Codex command. The variant below adds an isolated browser profile for a clean first task:
codex mcp add chrome-devtools -- npx -y chrome-devtools-mcp@latest --isolated
codex mcp list
codex mcp get chrome-devtools
The first command changes Codex configuration. Review the existing entry before adding another server with the same purpose. The next two commands inspect registration; they do not establish that Chrome has opened or that a page tool succeeded.
Using @latest is convenient for initial setup. Once the task works, record the resolved server, Codex, Node and Chrome versions and pin the package for a reproducible team configuration. A later package update can change available tools or arguments.
What belongs in the Codex MCP configuration?
Codex's MCP entry describes how to start the server process. The official Codex MCP documentation explains stdio configuration and client timeouts. Merge this section into your existing configuration instead of replacing the file:
[mcp_servers.chrome-devtools]
command = "npx"
args = ["-y", "chrome-devtools-mcp@latest", "--isolated"]
startup_timeout_sec = 30
tool_timeout_sec = 60
The values here are chosen example limits. Startup timeout concerns initialization; tool timeout concerns a call after initialization. A larger startup limit will not repair a page locator that never matches. Use the Codex-documented seconds fields rather than assuming an older third-party milliseconds example still applies.
Choose the configuration surface for the client you actually use. Check the effective entry in that session, then start a fresh session if its tool catalog has not refreshed. A terminal command and a desktop settings screen can be looking at different loaded state.
The setup has separate checkpoints. Each requires its own evidence:
| Checkpoint | Useful proof | What it does not establish |
|---|---|---|
| Registration | The effective entry has the expected command and arguments | Server initialization |
| Initialization | The client loads tools without a startup error | Browser connection |
| Browser access | A real page-listing or navigation call succeeds | Task completion |
| Acceptance | A fresh observation confirms the requested result | Reliability on other sites |
Which Chrome connection mode should you choose?
Start with server-launched isolated Chrome for a public demonstration that needs no existing login. Attaching to an existing session is useful when its state is part of the task, but that changes the access boundary and requires its own verification.
The advanced usage guide distinguishes these modes. Select one deliberately:
| Mode | When it fits | Boundary |
|---|---|---|
Server launch with --isolated | A clean task in a temporary profile | Personal browser logins are not inherited |
--autoConnect | Inspect an already-running supported Chrome session | Chrome remote-debugging setup and the browser Allow dialog are required |
--browser-url=http://127.0.0.1:9222 | Attach to a separately launched debugging browser | The endpoint must already exist and reach the intended browser |
Auto-connect requires Chrome 144 or newer under the current documented setup. It also requires enabling remote debugging in Chrome and approving the connection. The server does not make an unopened browser or an unapproved session available by adding a flag.
For manual port attachment, use a separate user-data directory and keep the debugging endpoint local. The existing Chrome session guide covers that procedure. Do not combine multiple connection modes while trying to identify the first failure.
How do you verify actual Codex tool calls?
Verify the tool name, arguments and returned page evidence in Codex's execution history. A response that describes what the agent intends to do is not a browser operation.
Use the current Chrome DevTools tool reference to identify the available tools. Start with a page listing, open or identify the target, then take a fresh text snapshot. Use current page IDs and element identifiers rather than copying them from another run.
Use only the configured chrome-devtools MCP server for browser actions.
Open https://demo.playwright.dev/todomvc/#/ in a visible browser.
Report the tool actually called, the selected page ID and observed page URL.
Take a fresh snapshot and identify the todo input. Stop before changing it.
If a tool is unavailable or fails, report the exact error. Do not substitute
shell-based browser automation or another browser integration.
This first request intentionally stops before a write. It distinguishes a working browser connection from a model that selected a different route. Keep the returned evidence with the installed versions.
What is a useful first browser task?
A small TodoMVC persistence task checks navigation, observation, interaction and verification without requiring a personal account. The public TodoMVC demo is a training fixture, so the conclusion applies to that task.
Generate a unique text such as Codex DevTools check <run-id>. Create exactly one item, confirm it is initially unchecked, complete that same item and reload the tab. Preserve unrelated todos and check the exact text and completed state again after reload.
The acceptance record should expose what was observed, including failures:
| Check | Required observation | Stop condition |
|---|---|---|
| Created item | One exact matching row | Missing or duplicate rows |
| Completion | The same row becomes checked | A different row changes |
| Persistence | Exact text and checked state remain after reload | State disappears or remains ambiguous |
| Scope | Unrelated rows retain their previous state | Any unrelated mutation |
Save the real calls and a before/after record. A screenshot helps a person inspect the result; the fresh page observation supplies the text and state checks. If the task fails, keep that failure rather than presenting a manually repaired page as the original result.
The October 14 run record reports a passing task through Chrome DevTools MCP 1.10.1. Codex registered a dedicated user-level server, then sent actual MCP requests through a logging stdio client launched from its shell. This verifies the server-driven browser path; it does not establish that this active Codex chat loaded or invoked the server through its native tool catalog.
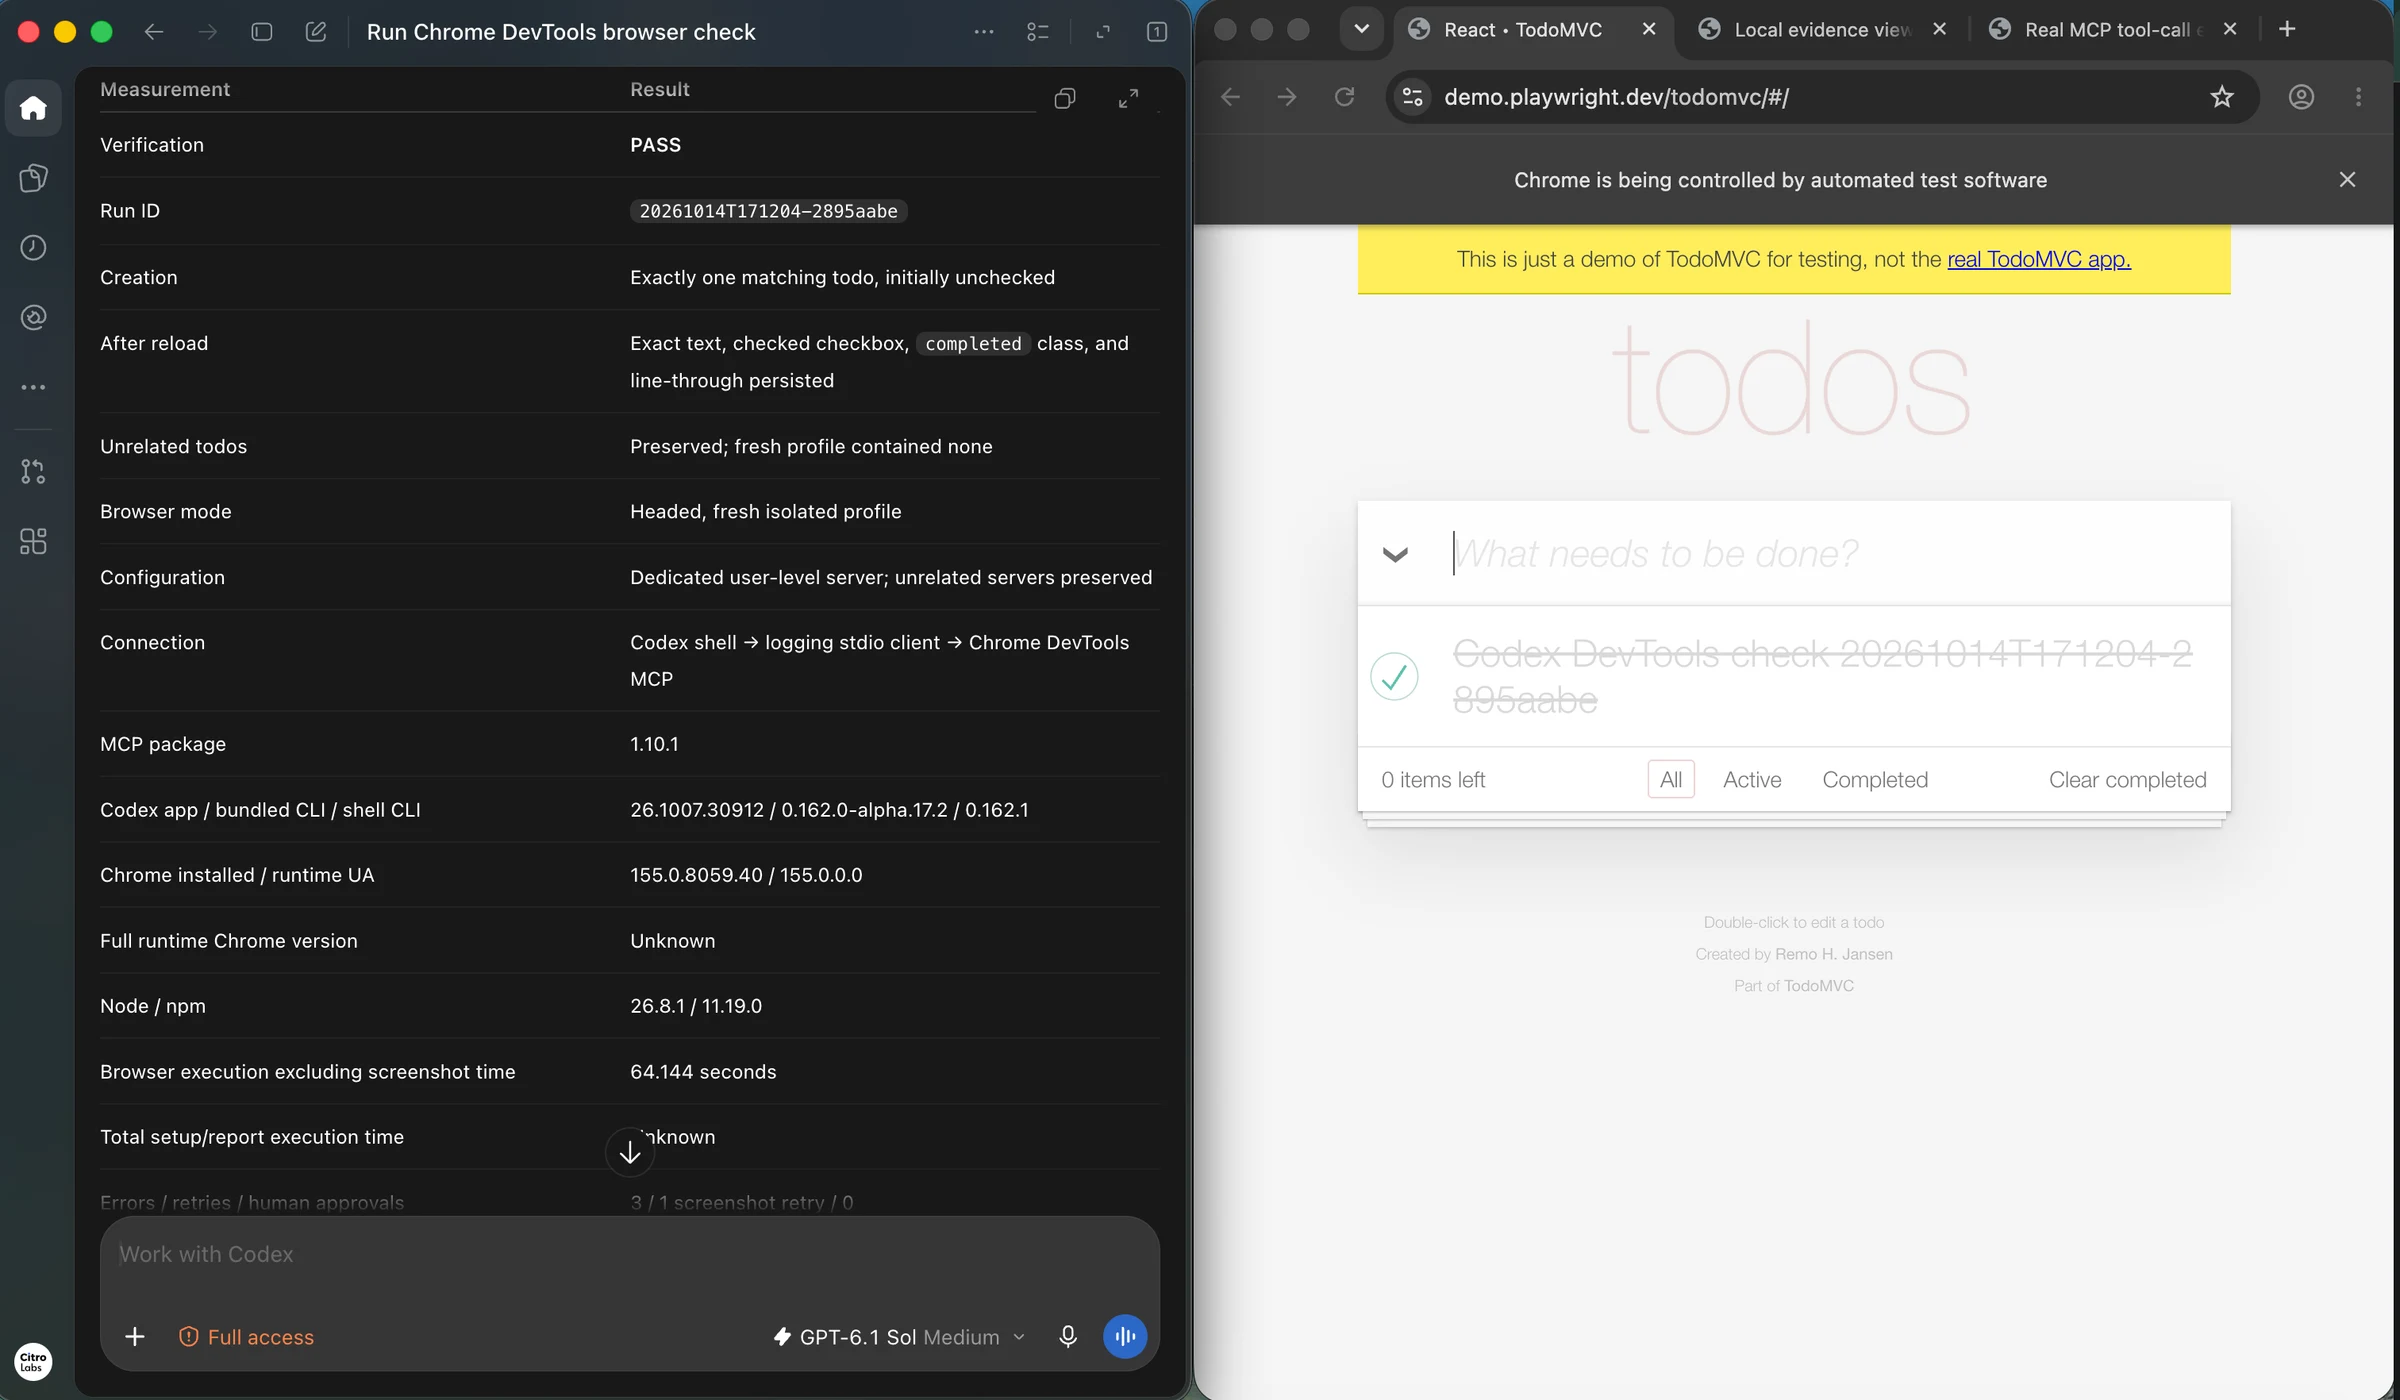
The browser began with a fresh isolated profile and no existing todos. The saved summary reports exactly one initially unchecked matching item, followed by completion and reload verification of the exact text, checked checkbox, completed class and line-through styling. The installed Chrome bundle was 155.0.8059.40; the runtime user agent reported 155.0.0.0, while the full runtime version remained unknown.
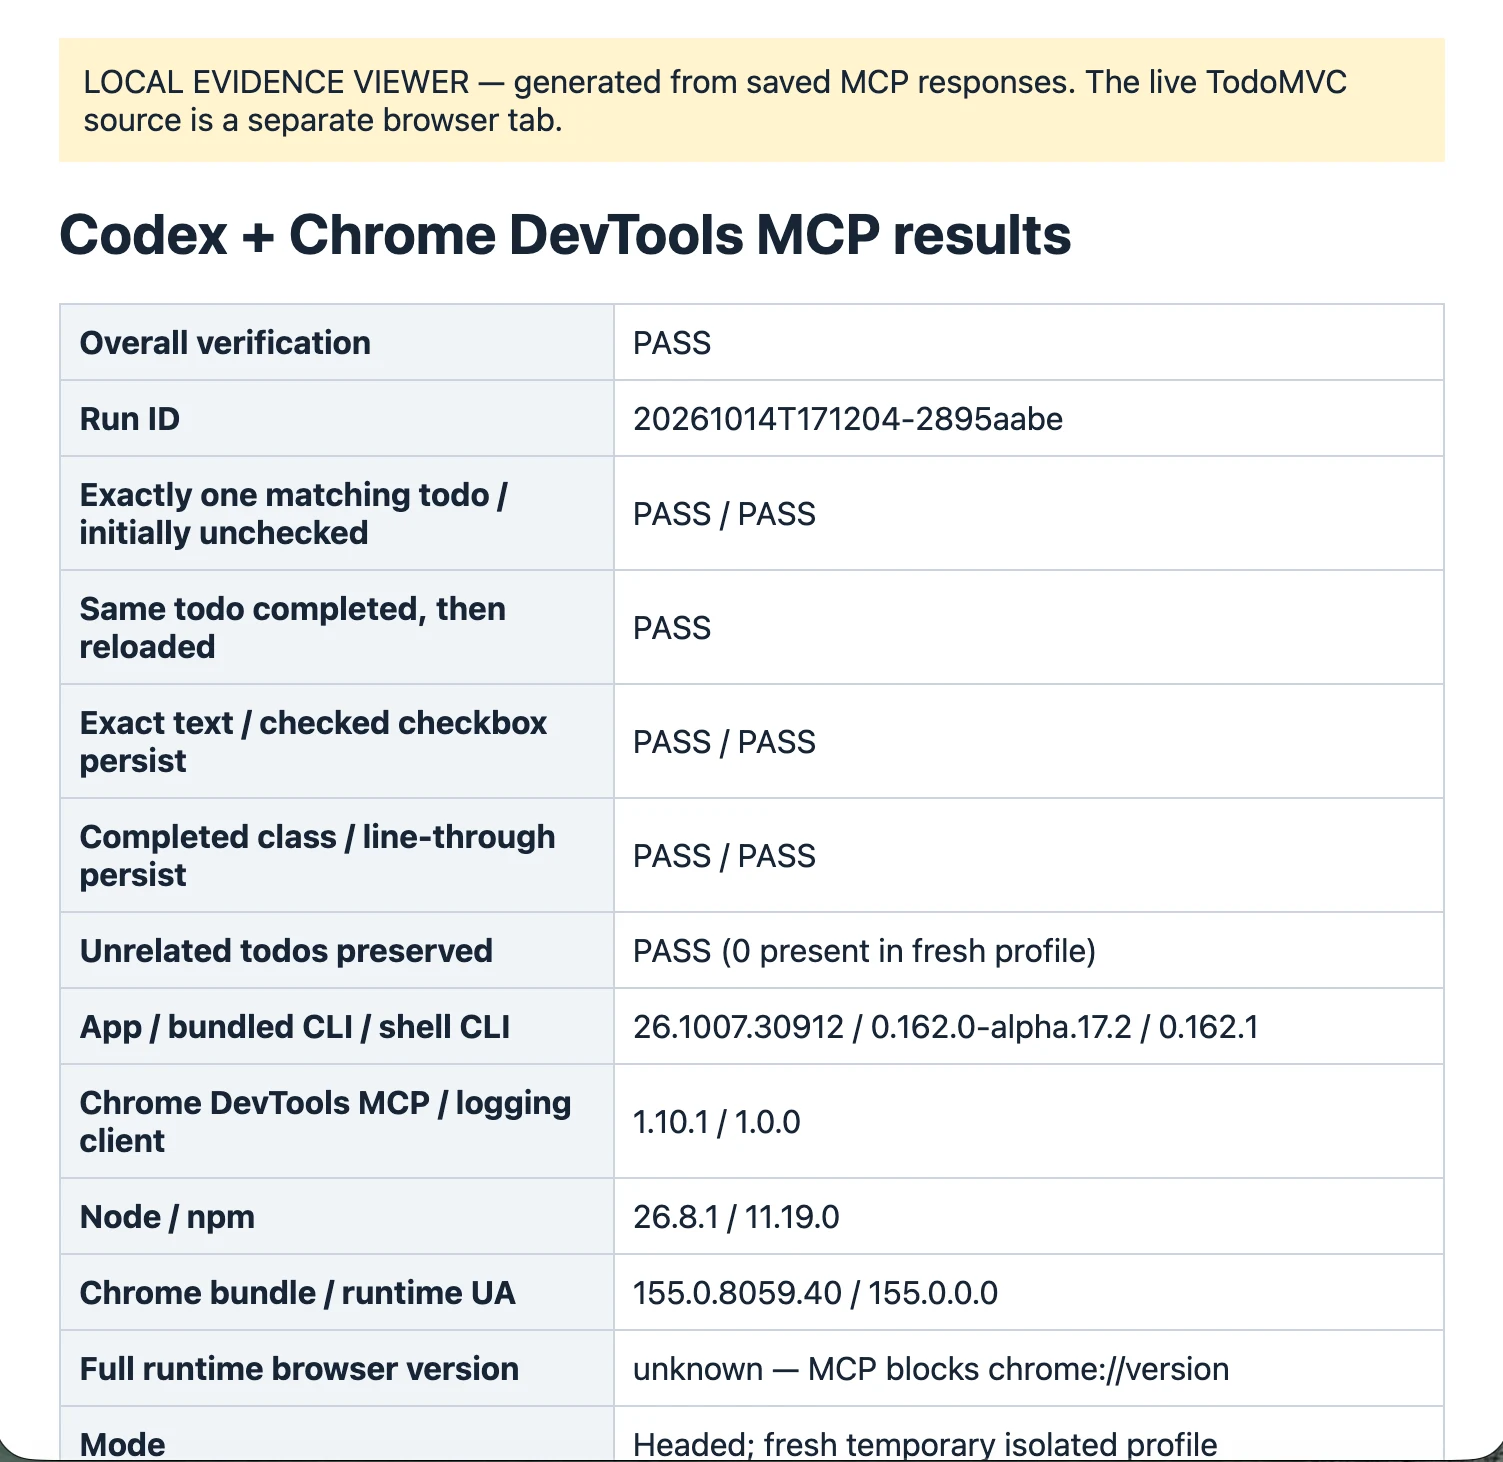
The supplied record also preserves setup friction: the server was absent from the active chat inventory, an initial configuration inspection exposed an authorization header before saved evidence was redacted, and a configuration rewrite omitted an existing empty args field that was restored. The summary reports three errors, one screenshot retry and zero human approvals. Its 64.144-second browser execution measurement excludes screenshot time; total setup and reporting time is unknown. Inspect and redact configuration output before sharing it.
How do you isolate connection and tool failures?
Locate the first failed checkpoint before changing configuration. Browser launch, MCP initialization and a page action can fail for different reasons.
The official troubleshooting guide recommends checking the runtime used by the client and retaining the server error. Use a targeted correction:
| Observation | Check next | Recovery boundary |
|---|---|---|
| Entry missing | Active config and server name | Repair registration, then rediscover tools |
| Initialization times out | Node/npm path, package download and startup log | Change the cause before extending the limit |
| Tools load but Chrome fails | Browser executable, connection mode and profile ownership | Restart only the task-owned browser |
| Existing-browser attachment fails | Endpoint or Chrome permission state | Obtain the intended connection, not another profile |
| Wrong tab or stale identifier | Current page list and snapshot | Refresh identifiers before an action |
| Timeout after a write | Current application state | Inspect whether the write happened before retrying |
A browser's existing user-data directory can be owned by another process. Use a separate profile for the task instead of closing unrelated user windows. Avoid broad cache deletion or disabling client protections as a first response to an unknown error.
What access and data boundaries matter?
A connected DevTools server can inspect and modify content in the browser instance it controls. A task scoped to one public tab should not become permission to inspect unrelated authenticated pages.
Review the server's usage-statistics disclosure and current data options when the task involves sensitive URLs or traces. The server's metrics setting and Chrome's metrics setting are separate. Inspect logs before sharing them because page URLs and captured content may identify private work.
A client approval permits a tool invocation under the client's policy; it does not prove that a business action is authorized. State the exact permitted actions in the task and stop at access or decision boundaries that require a person.
Where does ego (lite) fit in a Codex browser workflow?
A visible ego (lite) Space is useful when the next step needs a person to inspect the source, pause execution or continue in the same browser context. Its ego-browser documentation describes the agent connection, while the Space guide explains the browser workspace.
The independent October 14 reference run used Codex desktop and the installed ego-browser helper in the named Space Codex comparison: ego. The source began with four existing todos. Its supplied validation record reports that the new item's exact text and completed state survived reload, while all four existing rows retained their text, checkbox state, class and order.
ego (lite) is a different browser execution route. It does not repair this MCP entry or replace DevTools-specific diagnostic APIs. Choose it when shared inspection is the requirement; use the verified DevTools path when the task depends on its inspection tools.
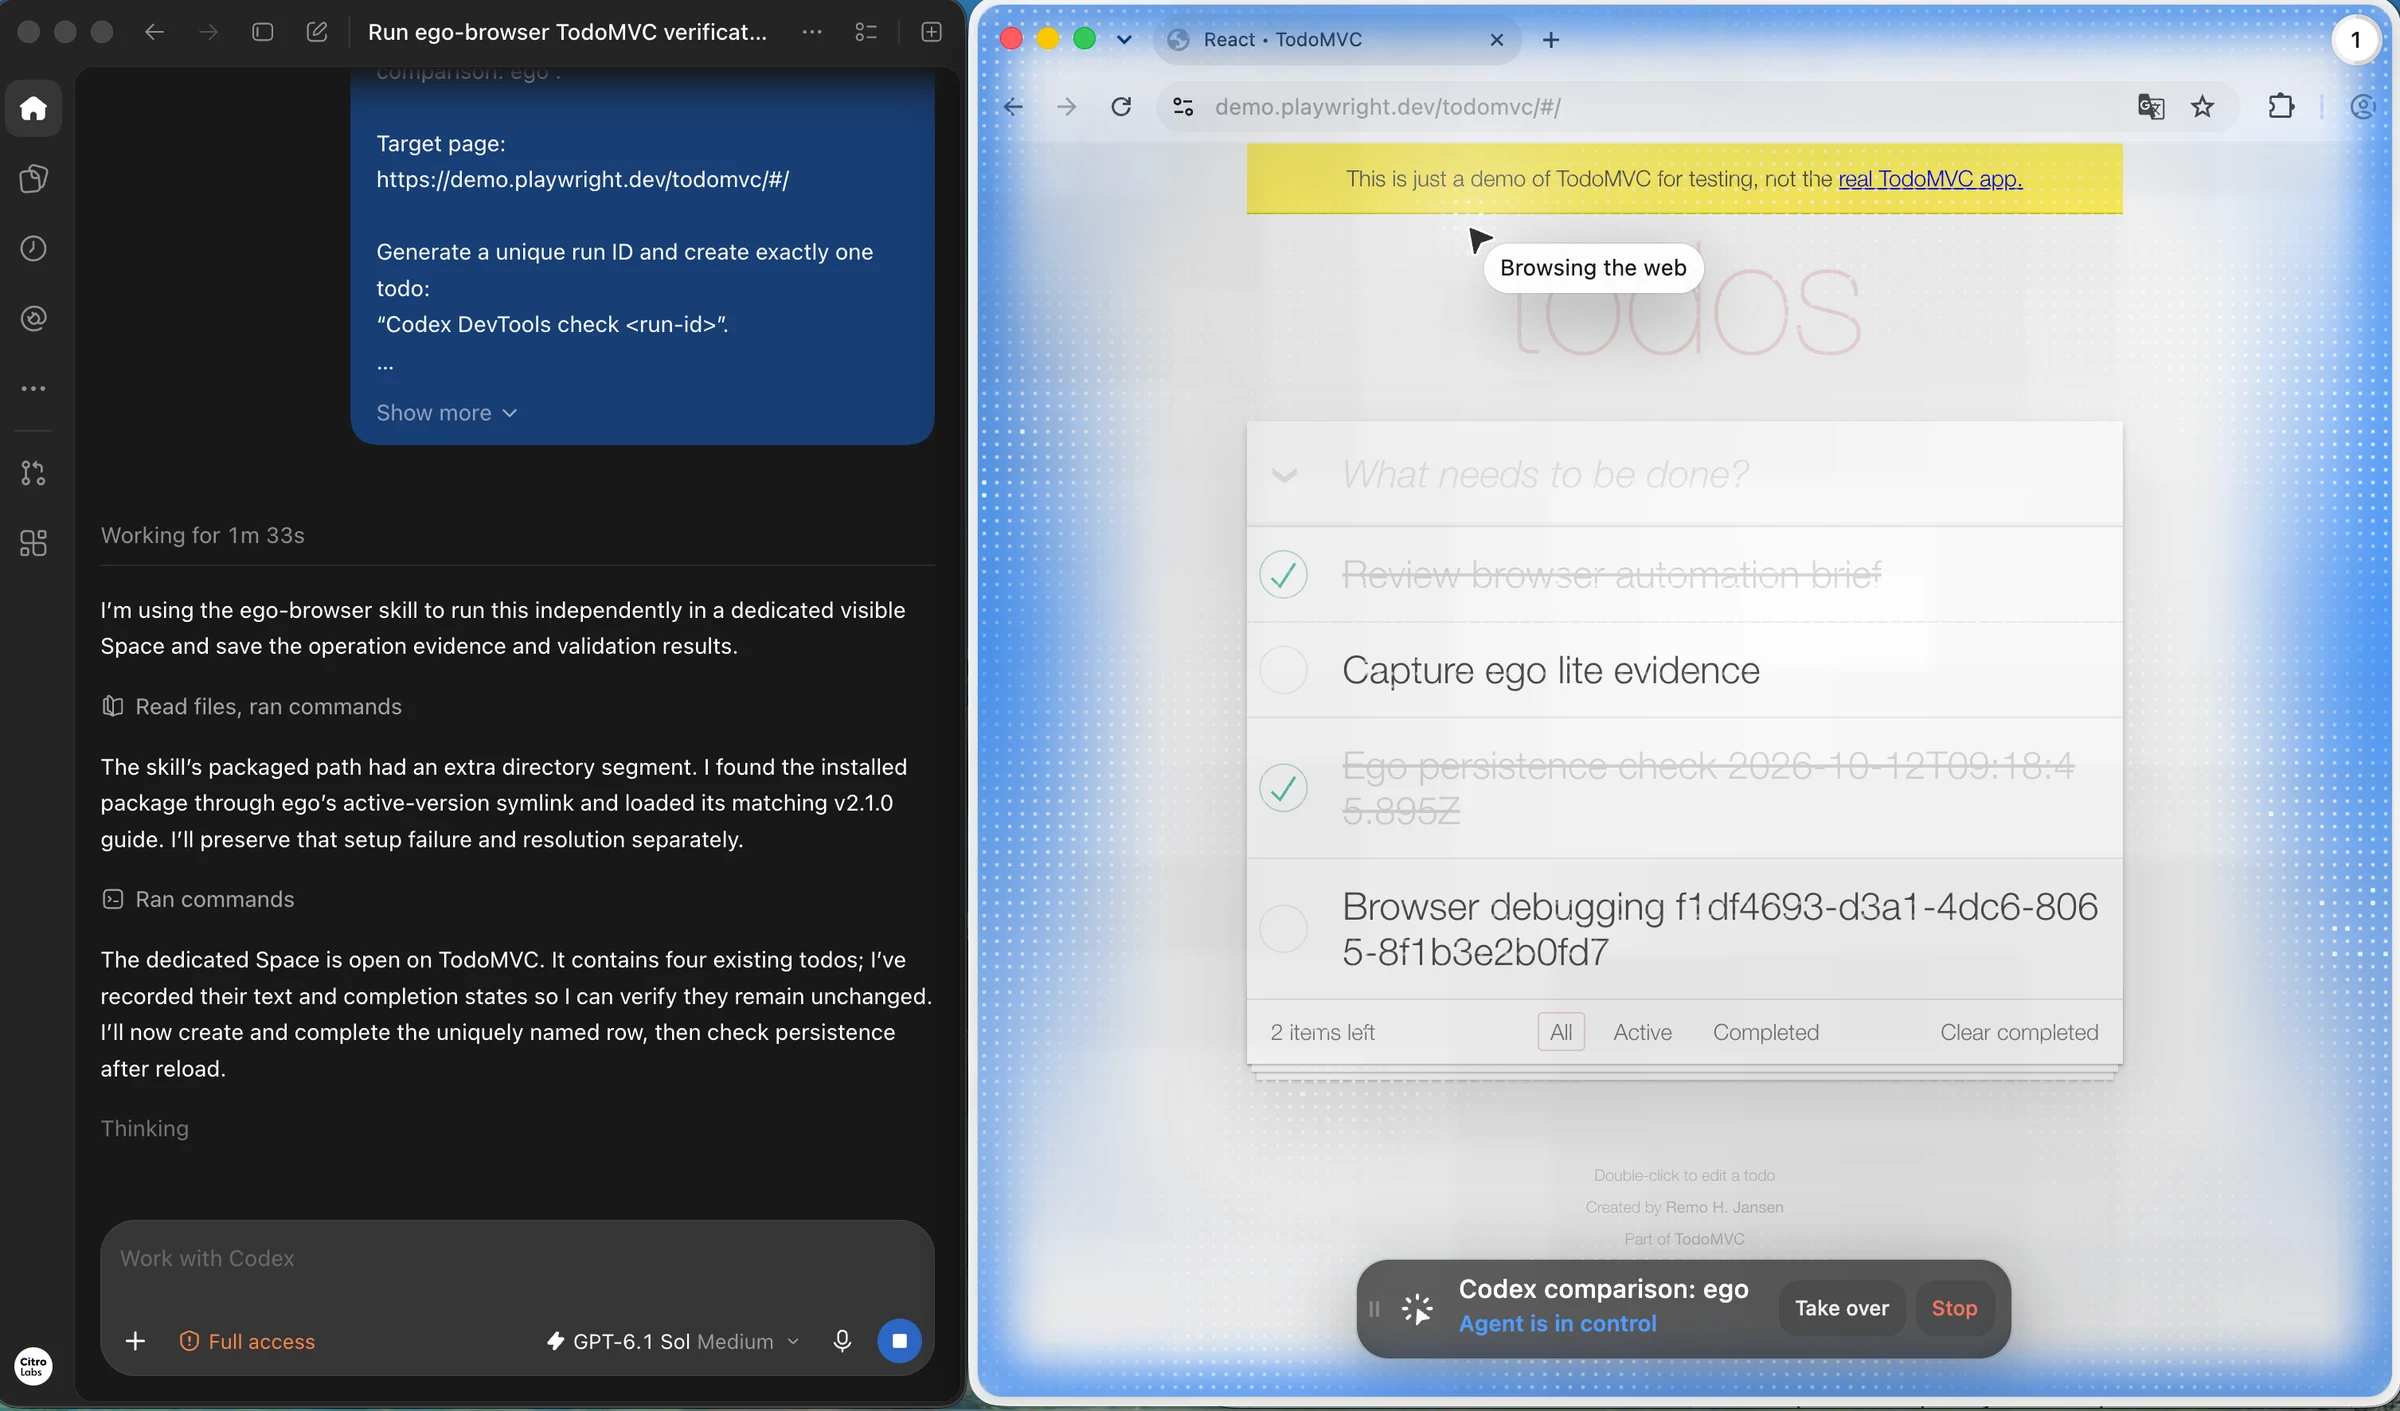
The run used ego (lite) 0.6.0.5, Chromium 154.0.8037.44 and packaged skill guide 2.1.0. The record preserves a missing packaged-path error, a completion-selector error and an unsupported optional Browser.getVersion query. The agent inspected the page and corrected one completion attempt without recreating the todo; it reports zero task interventions. The existing helper was used without an install, upgrade or configuration change.
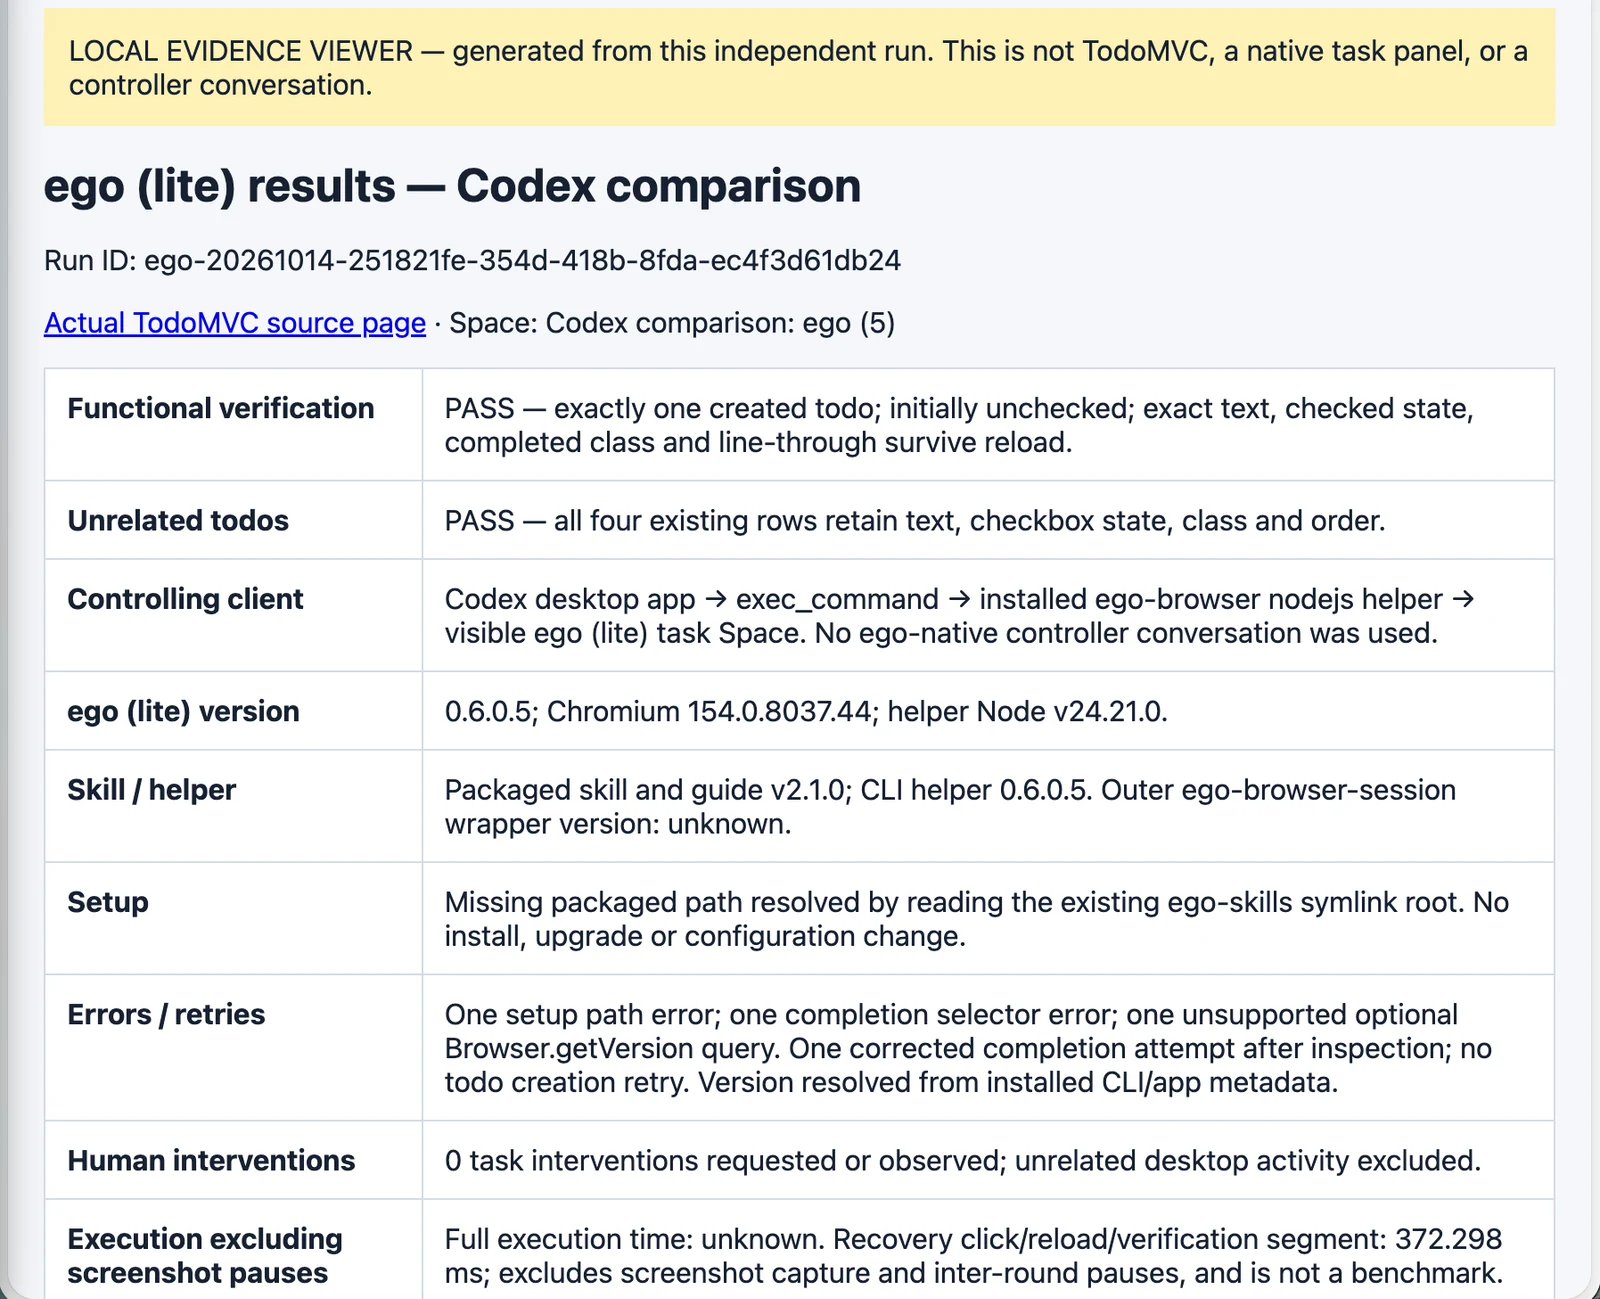
These examples help choose an inspection workflow. The DevTools path provided server-driven browser operations in an isolated profile; ego (lite) kept the task in a visible named Space with takeover controls. Both supplied records report acceptance of the small persistence task, with different setup paths and starting state. They do not support a speed ranking: ego's full duration is unknown, and its 372.298-millisecond recovery, reload and verification segment covers only part of the task.
FAQ
These answers address configuration boundaries that commonly get confused during a first connection.
Does adding the server prove Chrome works?
No. Adding the server records configuration. Verify initialization, a genuine page tool call and the intended browser independently.
Does this local MCP server need a provider API key?
The stdio server configuration shown here has no provider API-key field. Codex still needs its own working account or model access; those are separate from the browser server.
Is this the Codex Chrome extension?
No. This guide configures an MCP server. The Codex browser guide covers the extension and broader browser choices.
Can a longer timeout fix every failure?
No. It can accommodate a slow initialization when the logs support that diagnosis. It cannot create a missing target, correct a wrong profile or grant browser access.
Will isolated Chrome contain my personal logins?
No. Treat its temporary profile as separate browser state. Choose an explicit existing-session route if that state is required and authorized.
Why do terminal and desktop launches behave differently?
They can start with different environment paths or loaded configuration. Compare the process command and runtime seen by the actual MCP client.
Can multiple Codex sessions use one profile?
A profile owned by another browser process can conflict. Use separate isolated profiles for independent tasks and record which session owns each browser.
Should I copy a page ID from the article?
No. Obtain the page ID from the current tool result. Element identifiers also need a fresh snapshot after navigation or a state change.
What should I do after a timeout on completion?
Inspect the exact todo before retrying. A missing tool response can leave the write outcome uncertain, even when the page already changed.
Is a TodoMVC pass a CI test qualification?
No. It verifies one browser task. A reusable CI test needs its own assertions, repeatability and execution environment review.
Related reading
Continue with the guide that owns your next configuration or verification question.
- Connecting Chrome DevTools MCP to an existing browser
- Codex browser paths and extension setup
- Verifying browser agent completion
For a visible browser workspace with a human handoff, try ego (lite).