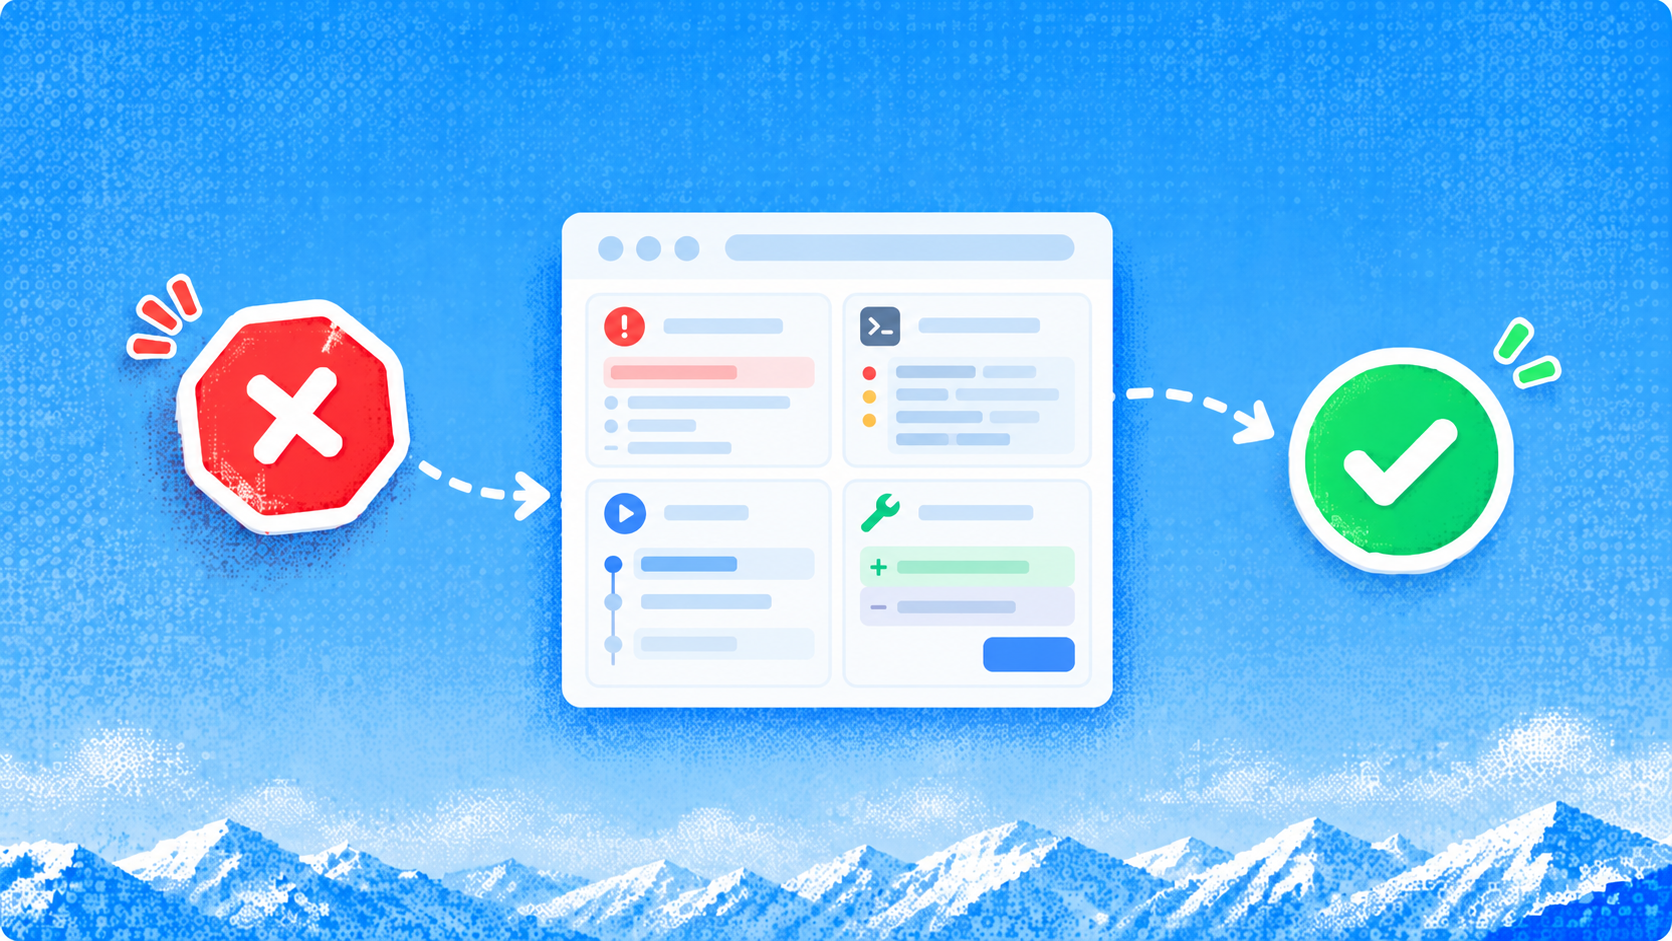
The browser is still open. The agent says the task is finished. The record you expected to change looks exactly as it did before.
Debugging AI agent browser automation failures means finding where the task first diverged from its intended state: what the agent observed, what it planned, what the browser executed or how completion was checked. Capture that boundary before changing the prompt or replaying the workflow.
This guide provides a diagnostic sequence and a bounded recovery plan. Two supplied October 13, 2026 TodoMVC demonstrations show an intentionally incorrect target, retained failure evidence and a pause before recovery. The separate request-record example is hypothetical, and the logging snippet is an implementation pattern.
How do you find the first failing boundary?
Follow the task in order and locate the first unsupported transition. A correct plan based on the wrong page is still an observation problem. A successful click followed by a rejected save needs application evidence before you blame the locator.
The four boundaries below are a practical diagnostic framework. Environment and application failures can affect several boundaries, so keep their evidence separately instead of forcing every incident into a single model-error category.
| Boundary | Question to answer | Evidence to inspect |
|---|---|---|
| Observation | Did the agent receive the right current page and record? | URL, tab/frame, screenshot, DOM or accessibility snapshot, timestamp |
| Planning | Did the chosen next action satisfy the task and its constraints? | Task contract, supplied observation, selected action and arguments |
| Execution | Did the intended action reach the intended element and application? | Locator resolution, action errors, dialogs, relevant network responses |
| Verification | Did a fresh read establish the required outcome? | Exact record after reload, stored state where available, required-field checks |
For each transition, write down expected state, observed state and the evidence supporting it. An agent's explanation can help identify its intended action, but it is not a substitute for the page state or application response.
Suppose the task is to mark request REQ-42 ready without changing its owner. If the initial screenshot contains REQ-24, start at observation. If the screenshot contains the right request but the plan edits its owner, start at planning. If the correct action is chosen but a save returns an error, examine execution and the application boundary.
Avoid changing several layers at once. Replacing the model, locator and retry policy together can produce a successful next attempt while leaving the original cause unexplained.
What should you capture before trying again?
Capture a small incident record before a retry changes the page. It should let another person reconstruct the intended target, last confirmed state and uncertain action without relying on the agent's memory.
| Incident field | Why it matters |
|---|---|
| Task and acceptance rule | Establishes the outcome and forbidden side effects |
| Exact URL and record identifier | Distinguishes a wrong target from a wrong action |
| Observation time and current page | Reveals stale or incomplete input |
| Chosen action and arguments | Connects the plan to the dispatched operation |
| Action result and relevant response status | Separates browser errors from application rejection |
| Last confirmed state | Provides a safe checkpoint for recovery |
| Versions and environment | Exposes changed tool contracts or browser behavior |
| Retry history and interventions | Prevents a repaired attempt from erasing earlier failures |
Keep evidence from the failing attempt as well as the recovery. Record unavailable information as unknown. A response status without the request target, or a screenshot without its time and URL, can be difficult to associate with the incident.
Limit captures to the task. Browser traces, console messages and request URLs can include account details or credentials. Redact secrets before sharing, retain the original securely when permitted and explain which details were removed. A sanitized export is different from an untouched raw record.
How do you diagnose an observation failure?
Compare the observation supplied to the agent with the current browser state. Confirm the tab, frame, URL and exact record before examining the action. If these disagree, a new prompt is unlikely to repair the missing input by itself.
Common causes include using a snapshot from before navigation, reading the wrong tab, missing an iframe or observing the page before relevant content appears. A screenshot may show a loading shell while a DOM read contains hidden or outdated elements. Use the representation that actually supplied the action decision.
Refresh the observation after navigation, an overlay, a filter change or another state transition. Then confirm the task-relevant identity and fields. Reading the entire page again is unnecessary when a focused snapshot can establish those facts.
For a controlled diagnosis, compare the original observation and a fresh one without acting. If the needed record appears only in the fresh snapshot, you have evidence of an observation gap. If both contain the right record, continue to the next boundary.
How do you diagnose a planning failure?
Inspect whether the chosen action follows from the task contract and the observation the agent actually received. Planning is the right boundary to investigate when the inputs identify the correct state but the proposed action violates the requested outcome or scope.
An ambiguous instruction can leave the planner unable to distinguish opening a record from modifying it. Missing completion criteria can lead it to stop after navigation. Repeatedly taking the same action without a new observation can turn uncertainty into a loop.
Tighten the contract: target record, required fields, permitted actions, stop conditions and completion check. For REQ-42, state that its owner must remain unchanged and that a fresh read must show the requested status. That makes the incorrect owner edit detectable before dispatch.
Version the task prompt, tool schema and relevant configuration. Compare changed decisions against fixed observations where possible. A visible error after a model update establishes timing, not causation; a controlled replay can test the suspected change without altering other inputs.
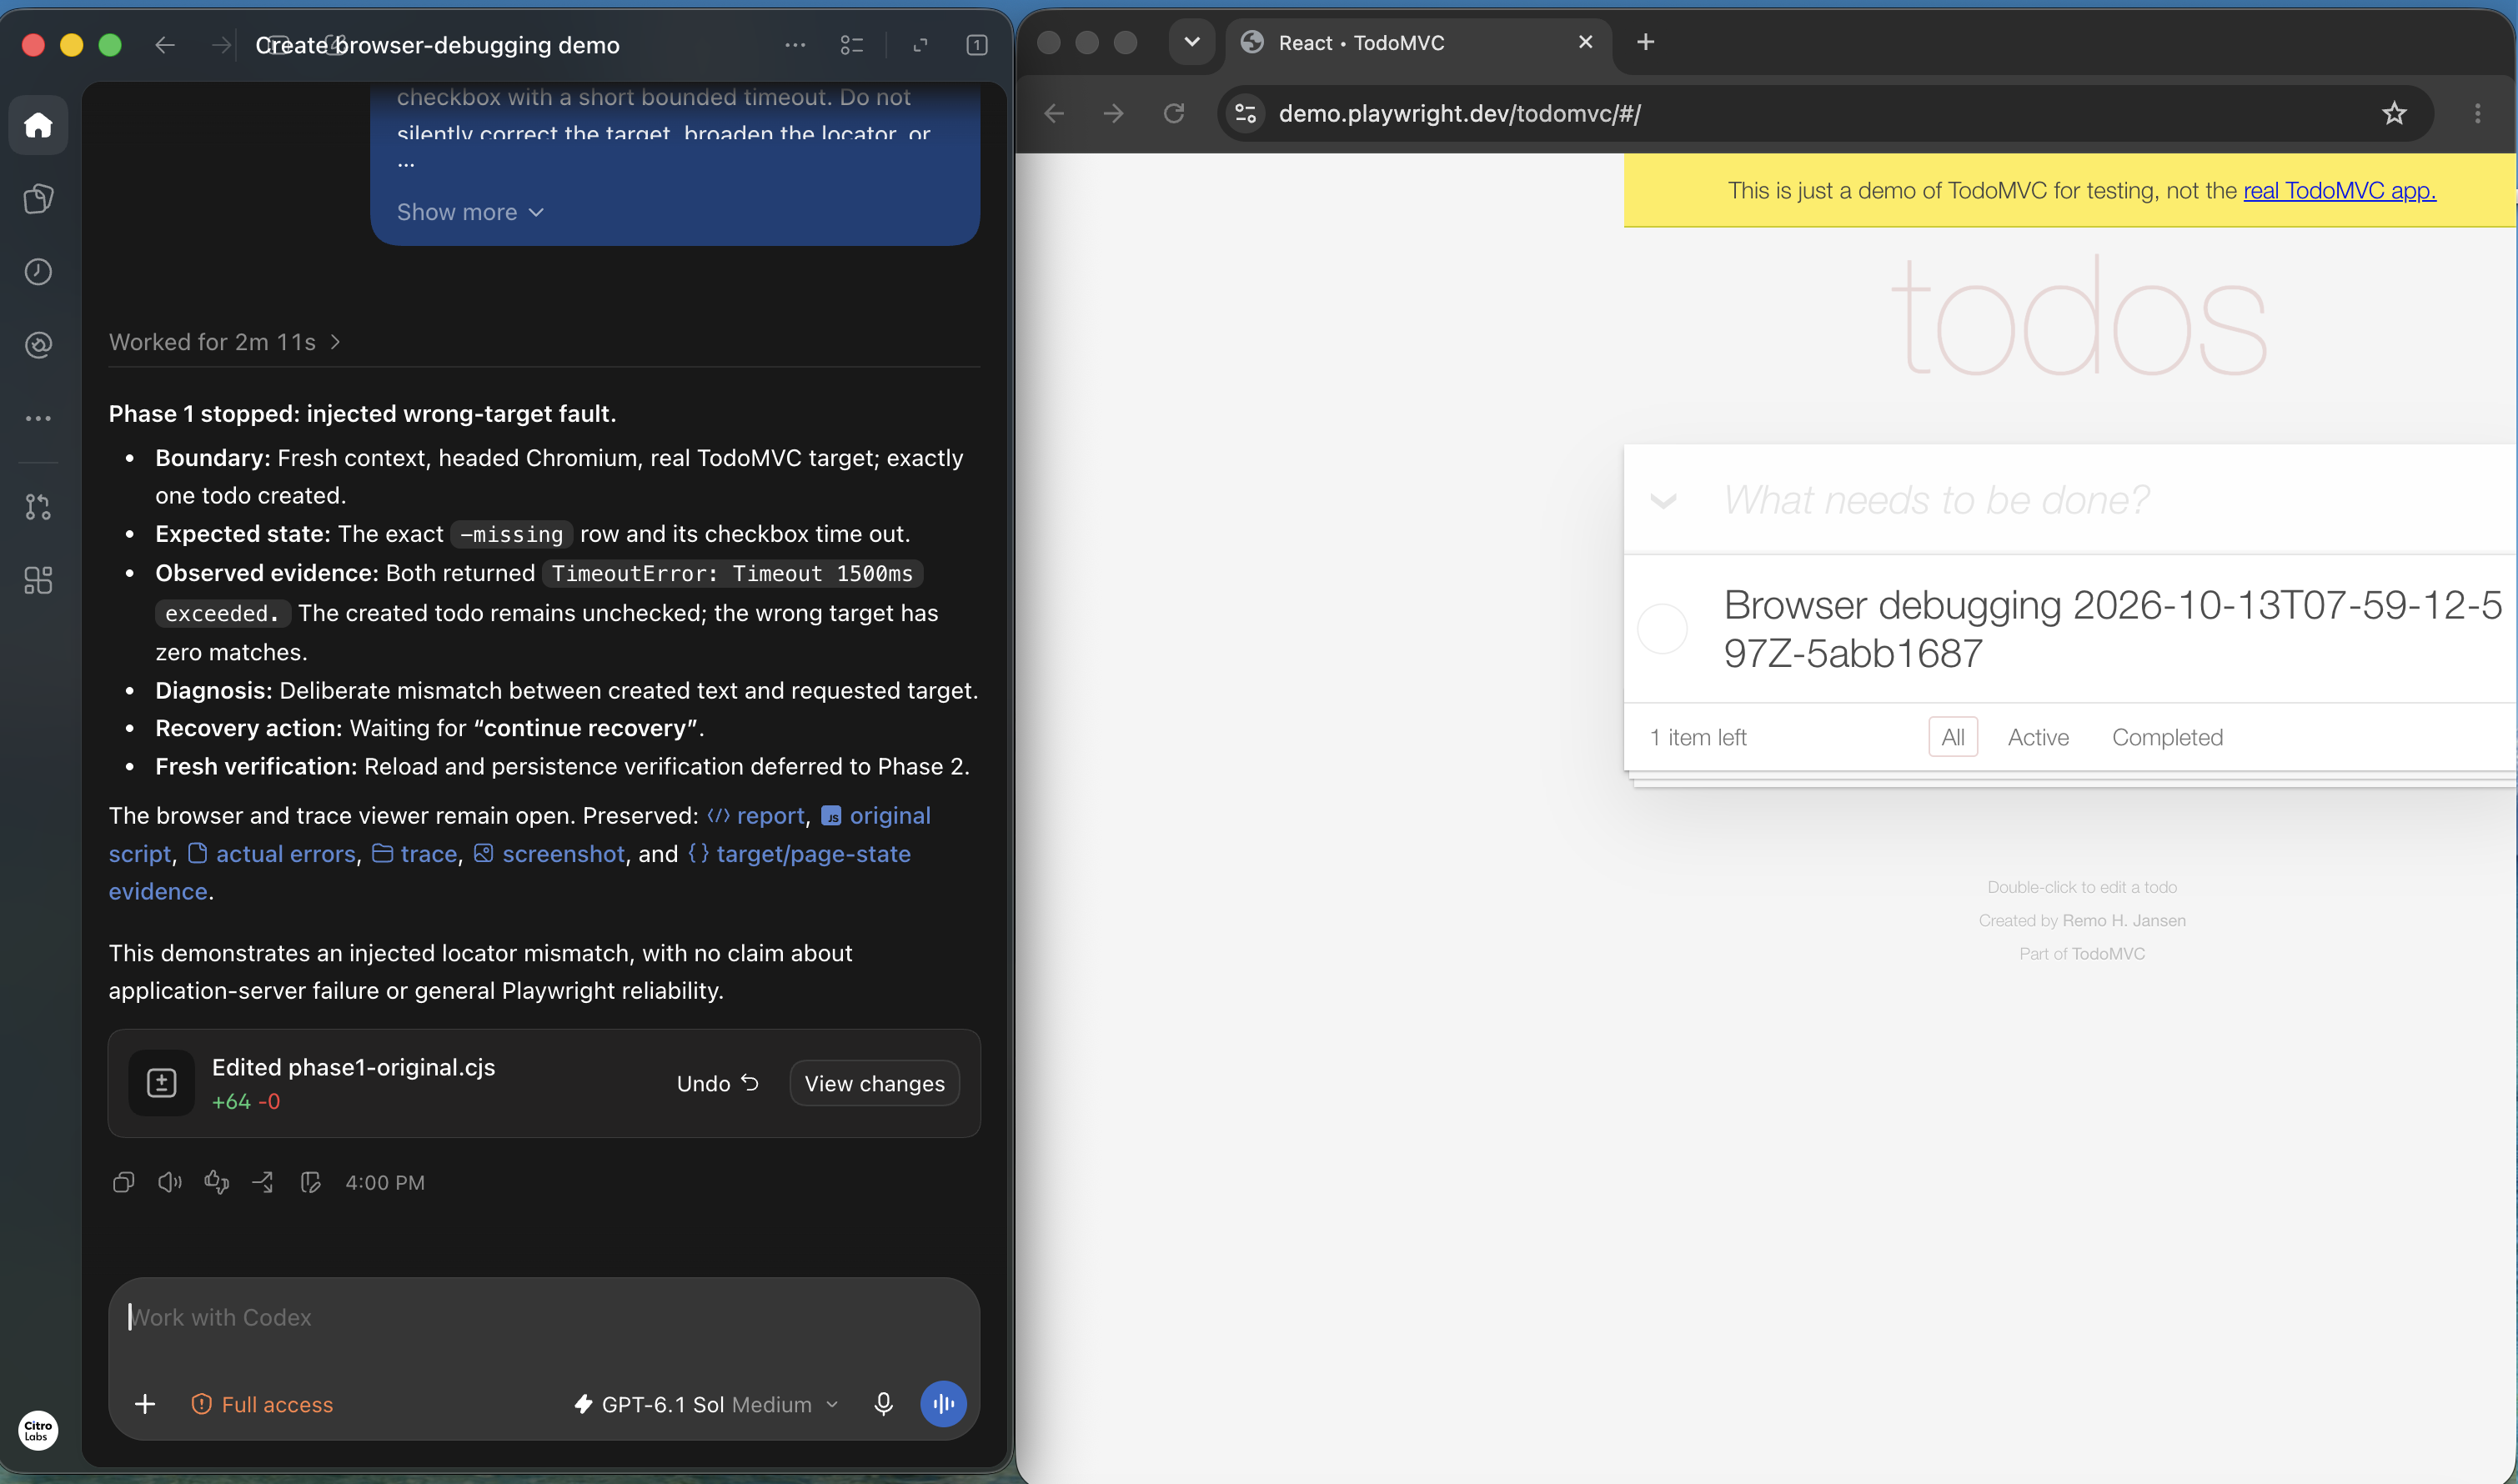
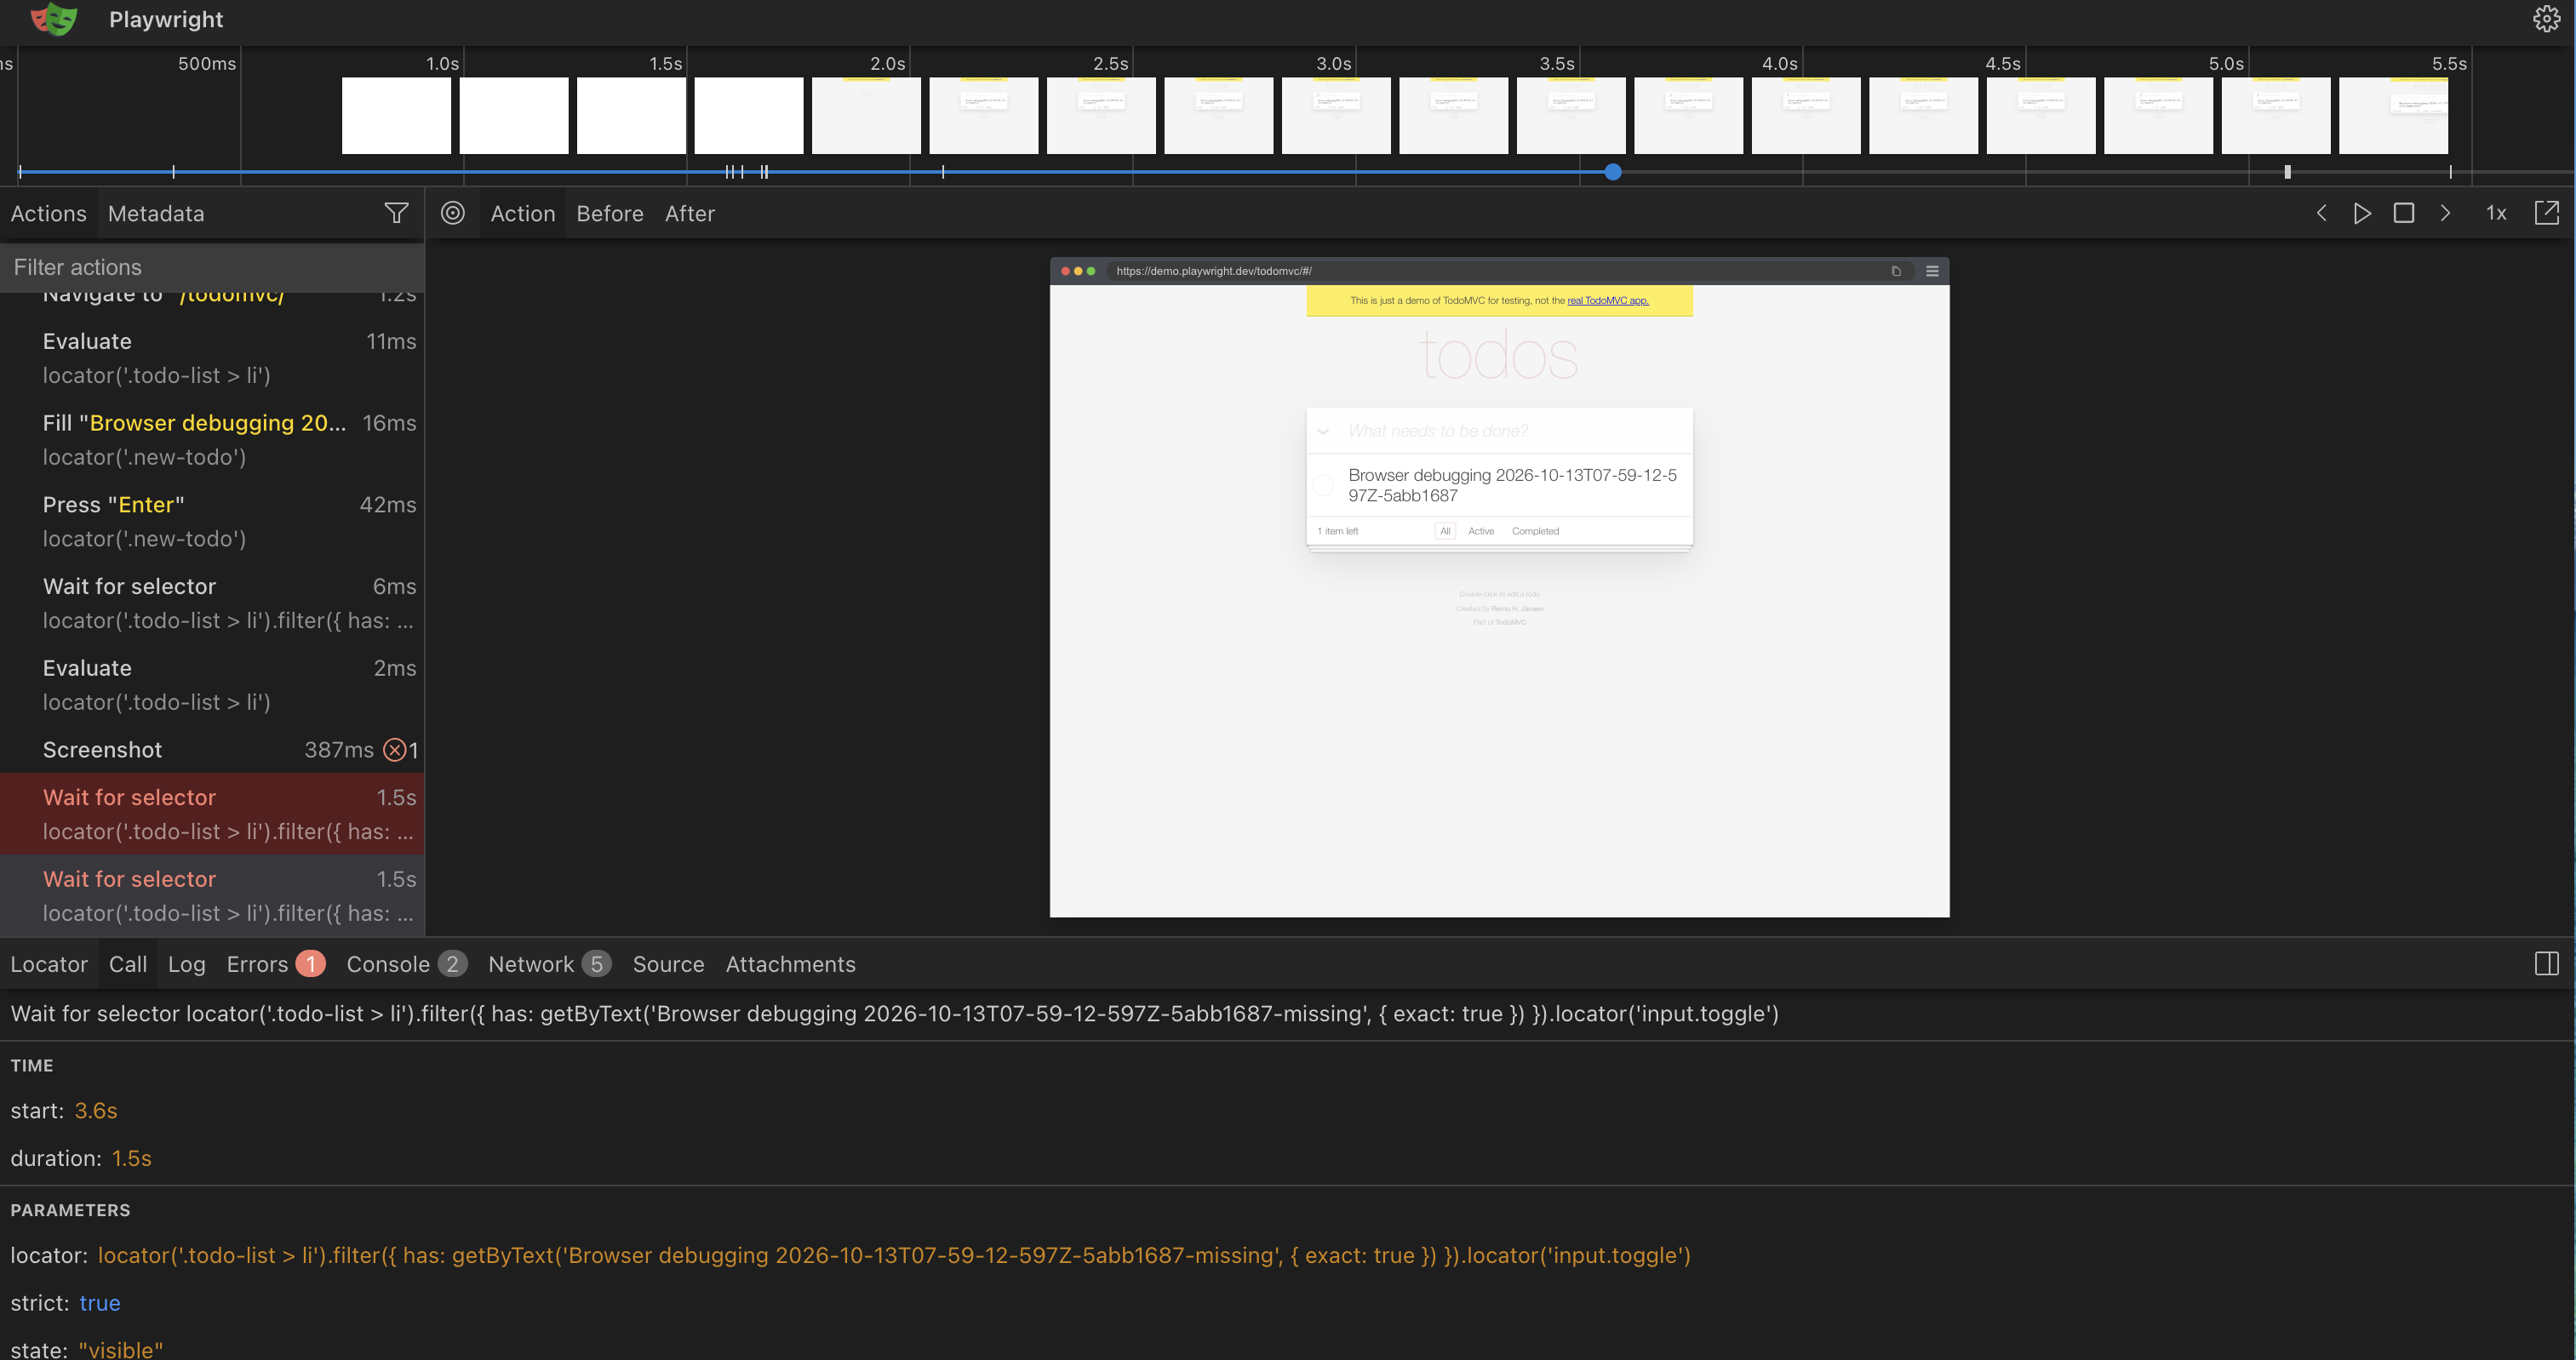
A controlled TodoMVC demonstration makes this boundary concrete. In the supplied Playwright run, the script creates exactly one uniquely named todo, then deliberately requests the same text with -missing appended. The current page has one created item and zero matches for the requested target. Two separate waits, one for the exact row and one for its checkbox, each return TimeoutError at a 1,500 ms bound. The item stays unchecked.
Open the full-resolution capture
The timeout is the execution symptom; the supplied target mismatch is the cause. This case does not show a model choosing the wrong target, an application-server failure or a general Playwright reliability problem. Increasing the wait cannot create a record whose exact text does not exist. Preserve the original target and ask for its correction before dispatching a completion action.
How do you diagnose execution and application failures?
Check the browser action and the application response separately. A timeout may come from an overlay or wrong locator, while a completed click may send a request that the server rejects. They need different fixes.
Playwright's actionability checks cover conditions such as visibility, stability and receiving pointer events. They help establish whether an action can run. They do not prove that the application stored the requested change.
Inspect locator scope before forcing a click. A page-wide button name may match several controls; a dialog or exact record container can provide the missing boundary. The locator guide explains current-element resolution and scoped selection. Increasing a timeout will not resolve ambiguity.
Check dialogs, permissions, frame boundaries and browser startup independently. An unsupported tool command or missing browser executable is an environment problem. Fix the installed tool contract or environment before asking the agent to reinterpret the website.
Network events require particular care. Playwright's request documentation states that HTTP error responses such as 404 and 503 still complete as HTTP responses. They do not automatically trigger requestfailed. Listening only for transport failures can miss the application error that explains the incident.
The following pattern assumes an existing Playwright page and an authorized task-specific origin. Install listeners before navigation or the action. It records a narrow set of diagnostic signals; add correlation identifiers and persistence appropriate to your application.
// Set this to the origin explicitly authorized for the task.
const taskOrigin = 'https://your-authorized-app.example';
const events = [];
const taskUrl = raw => {
  const url = new URL(raw);
  if (url.origin !== taskOrigin) return null;
  // Keep paths only after checking they contain no sensitive identifiers.
  return `${url.origin}${url.pathname}`;
};

page.on('response', response => {
  const url = taskUrl(response.url());
  if (url && response.status() >= 400) {
    events.push({ type: 'http-error', url, status: response.status() });
  }
});

page.on('requestfailed', request => {
  const url = taskUrl(request.url());
  if (url) {
    events.push({ type: 'transport-failure', url });
  }
});

page.on('pageerror', () => {
  // Inspect the actual error locally before exporting a sanitized summary.
  events.push({ type: 'page-script-error' });
});
A 503 in this log is evidence of a relevant HTTP error, not proof that it caused the task failure. Join it to the action time, request and record before drawing that conclusion. Unrelated analytics errors should not become the explanation for a failed save.
How do you diagnose a verification failure?
Re-read the exact target after the action and compare it with the acceptance rule. If the action appears successful but the required outcome is absent, preserve that discrepancy. Do not let the agent's completion message settle it.
In the hypothetical request workflow, a green save message could be optimistic UI. Reload REQ-42, confirm its status and confirm that its owner did not change. When authorized access to the stored record exists, a separate application or server read can add evidence about persistence.
If the state is unknown, say unknown. A timeout while checking the result does not establish either success or failure of the earlier write. Before retrying, determine whether the action already happened.
The dedicated browser agent verification guide explains how to prove completion and detect false success. Here the diagnostic question is narrower: did the verifier inspect the right record, fresh state and required fields, or did it accept a weaker signal?
Which trace viewer should you use?
Use the viewer that matches the trace format your tool produced. A browser trace, a Playwright trace and an agent execution trace expose different parts of the incident. They are not interchangeable files.
Playwright's Trace Viewer opens its saved trace archive and lets you inspect recorded actions, page snapshots and network activity. For Playwright Test, enable tracing on the failing run, then open the retained archive locally with the CLI.
npx playwright test --trace on
npx playwright show-trace path/to/trace.zip
The official agent-browser debugging documentation describes a Chrome Trace Event JSON format for its trace command. Use a compatible performance viewer for that format; renaming the file to trace.zip will not turn it into a Playwright trace.
Agent traces can expose selected tools and arguments. Browser traces can expose dispatched actions and page behavior. Neither alone establishes all the observations supplied to the planner or whether the server persisted a write. Join evidence using task, action and time identifiers.
Open the full-resolution capture
This retained Playwright trace belongs to the wrong-target run above. The timeline, exact locator and before/after snapshots show where execution stopped. A separate screenshot event is also marked with an error; do not erase incidental capture failures or assume every red entry has the same cause. The supplied phase-one evidence records both target waits and the unchanged incomplete item.
When is a retry safe, and when should you stop?
Retry only after identifying a plausible cause and a safe checkpoint. Repeating an uncertain write can duplicate work or modify the wrong state. First establish what has already happened.
| Observed condition | Recovery step | Stop boundary |
|---|---|---|
| Stale snapshot after navigation | Refresh state and confirm target identity | Identity still cannot be established |
| Locator blocked by overlay | Inspect overlay and use the permitted dismiss action | Dismissal changes scope or requires approval |
| Unsupported command or missing executable | Fix the matching runtime or tool contract | Environment cannot support the required task |
| Temporary error on a read | Retry with bounded backoff and capture attempts | Retry budget or deadline is reached |
| Write outcome unknown | Read the exact record before another write | Cannot determine whether it was applied |
| Login or access challenge | Hand off to the authorized user | Access remains unavailable |
Choose the retry limit before execution and record each attempt. A small finite budget is easier to reason about than an open-ended loop. Resetting the page is useful only when it preserves or deliberately restores a known task state.
After a fix, replay the smallest safe sequence from the last confirmed checkpoint. Change one suspected cause, capture a fresh observation and run the same acceptance check. Keep the original failure so the recovery can be explained rather than merely celebrated.
ego (lite) can help make that handoff visible. Its Space documentation describes the browser workspace, and the ego-browser documentation explains the agent connection. A person can inspect the live page and take over an authorized step while retaining the task context.
For a useful handoff, provide the exact target, last confirmed state, uncertain action and next permitted step. Visible browser controls aid review; they do not replace server evidence, reveal every model input or grant permission to bypass access restrictions.
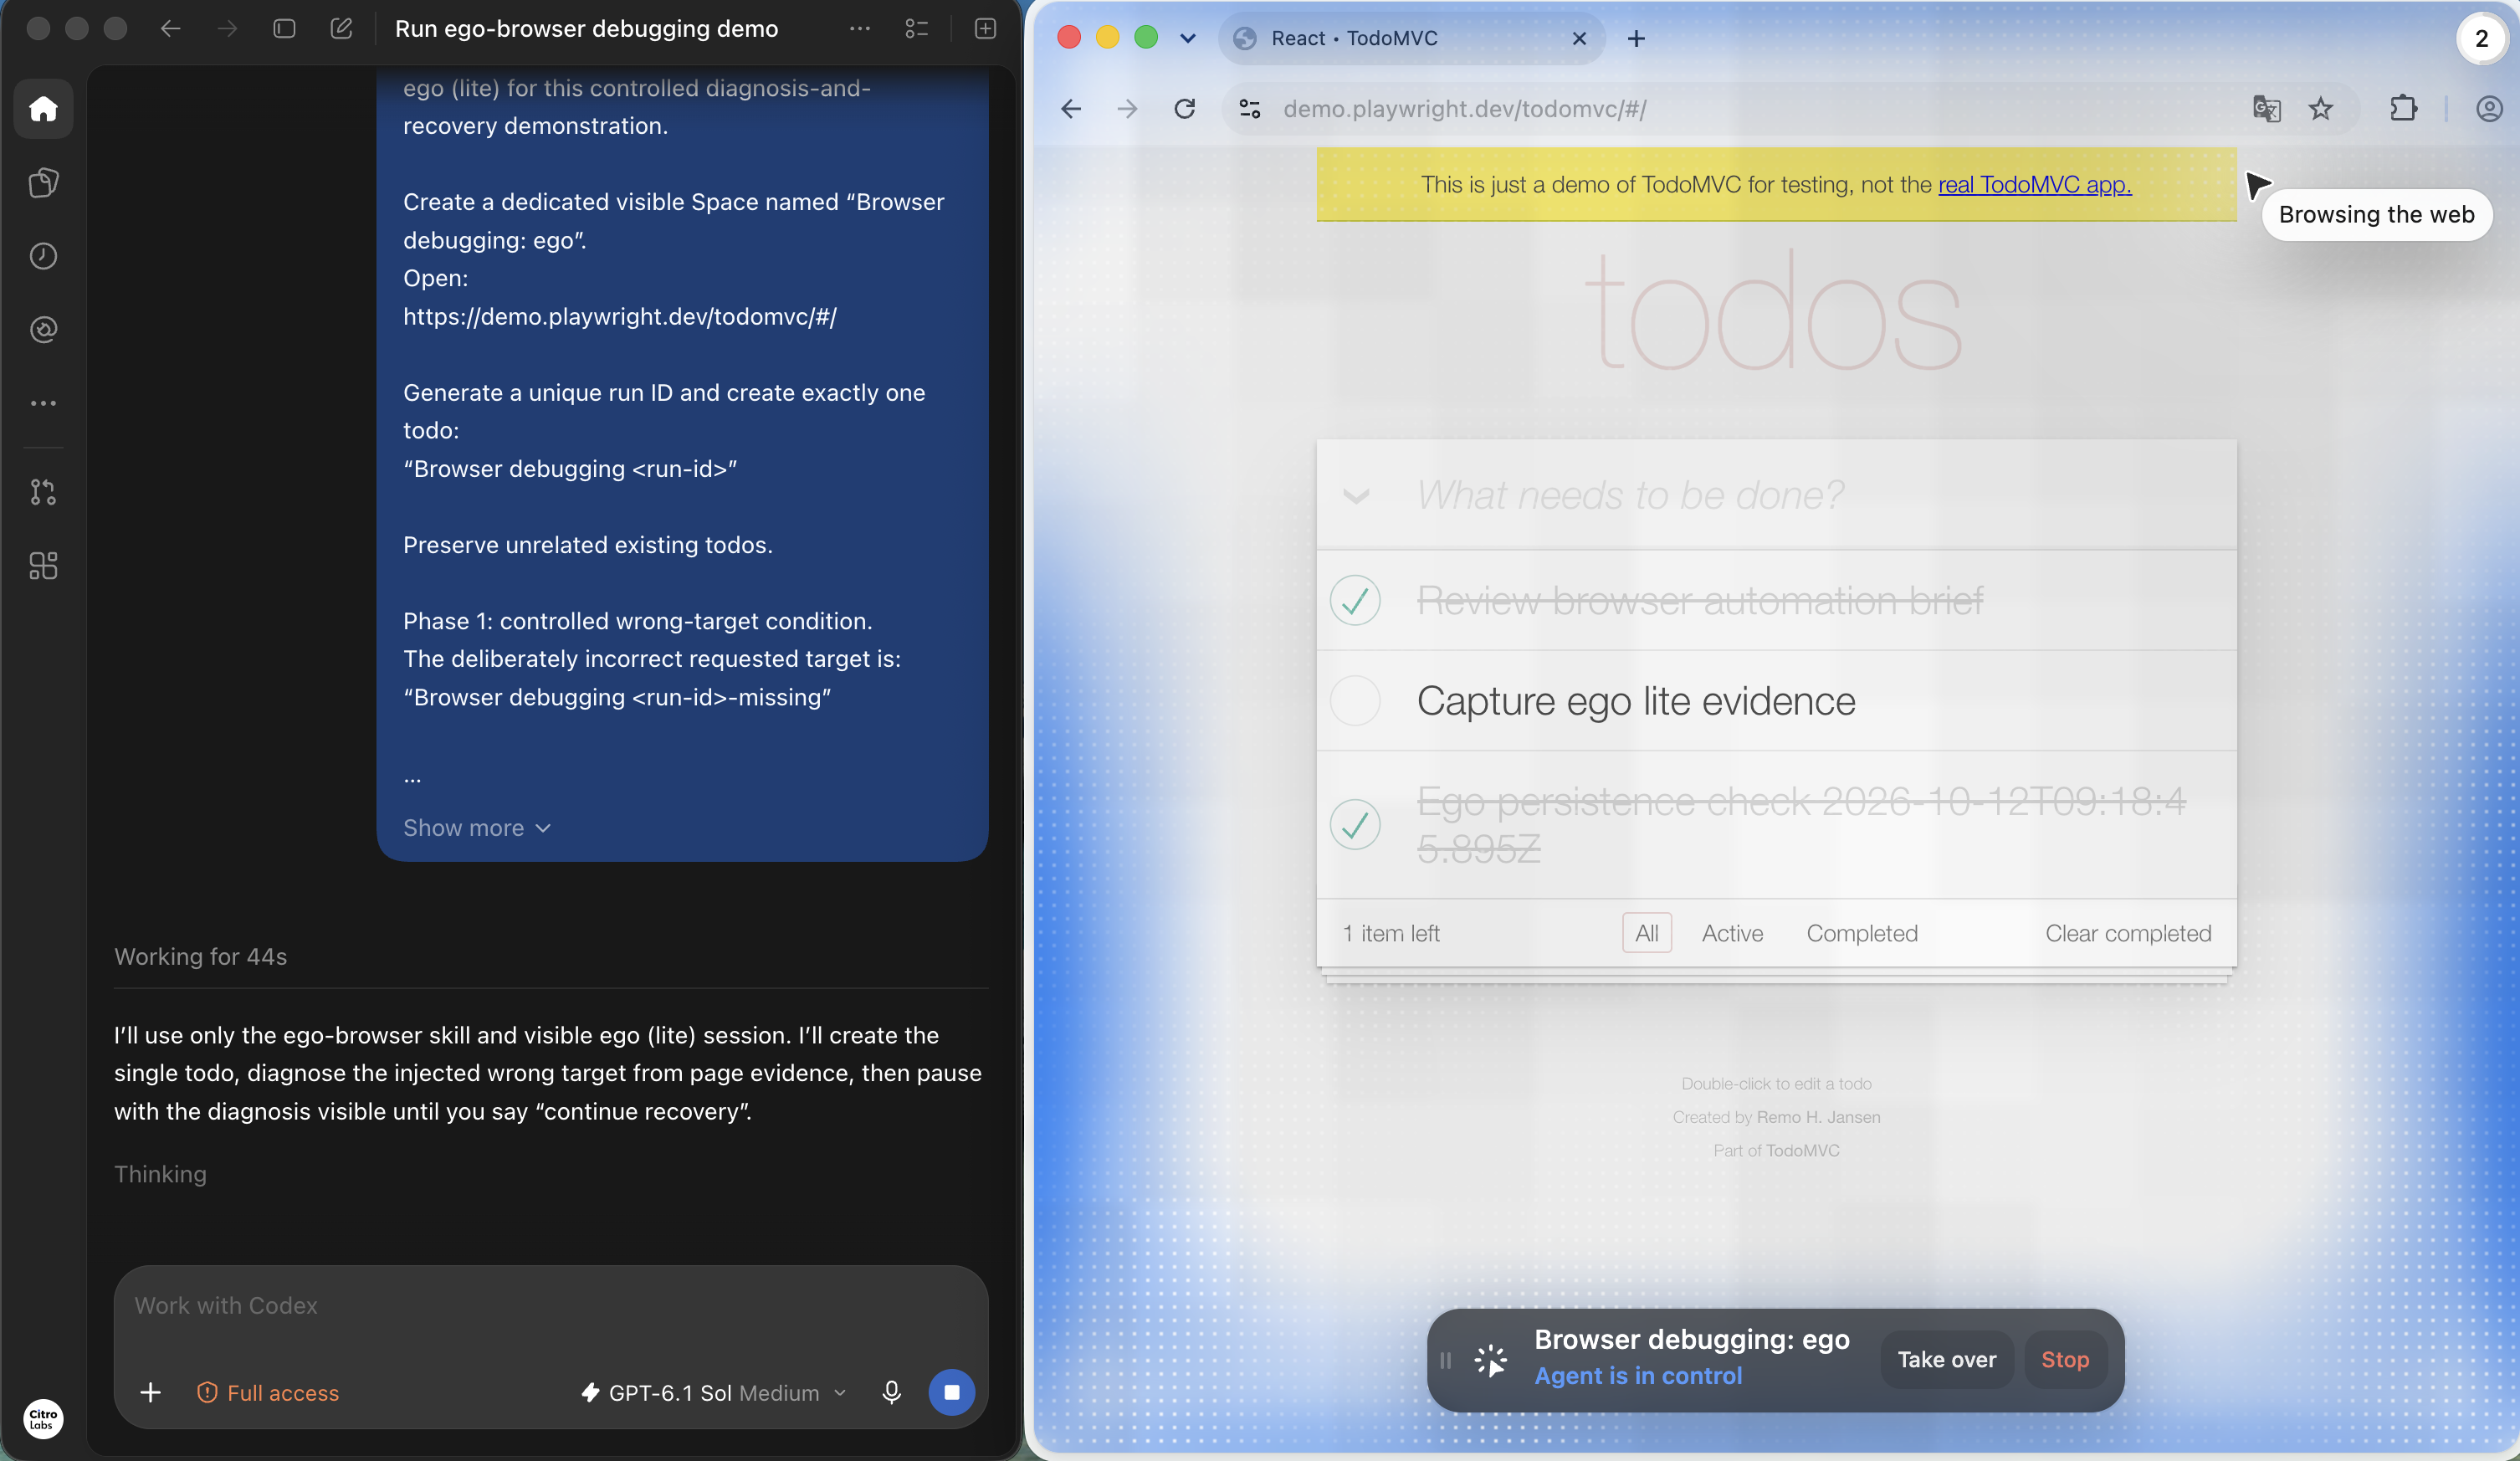
The separate ego (lite) demonstration uses the same wrong-target pattern in the Browser debugging: ego Space. The visible controller prompt defines the injected condition and the stop point. Unlike the fresh Playwright context, this Space already contains three unrelated todos, so the case also requires preserving their text and completion states.
Open the full-resolution capture
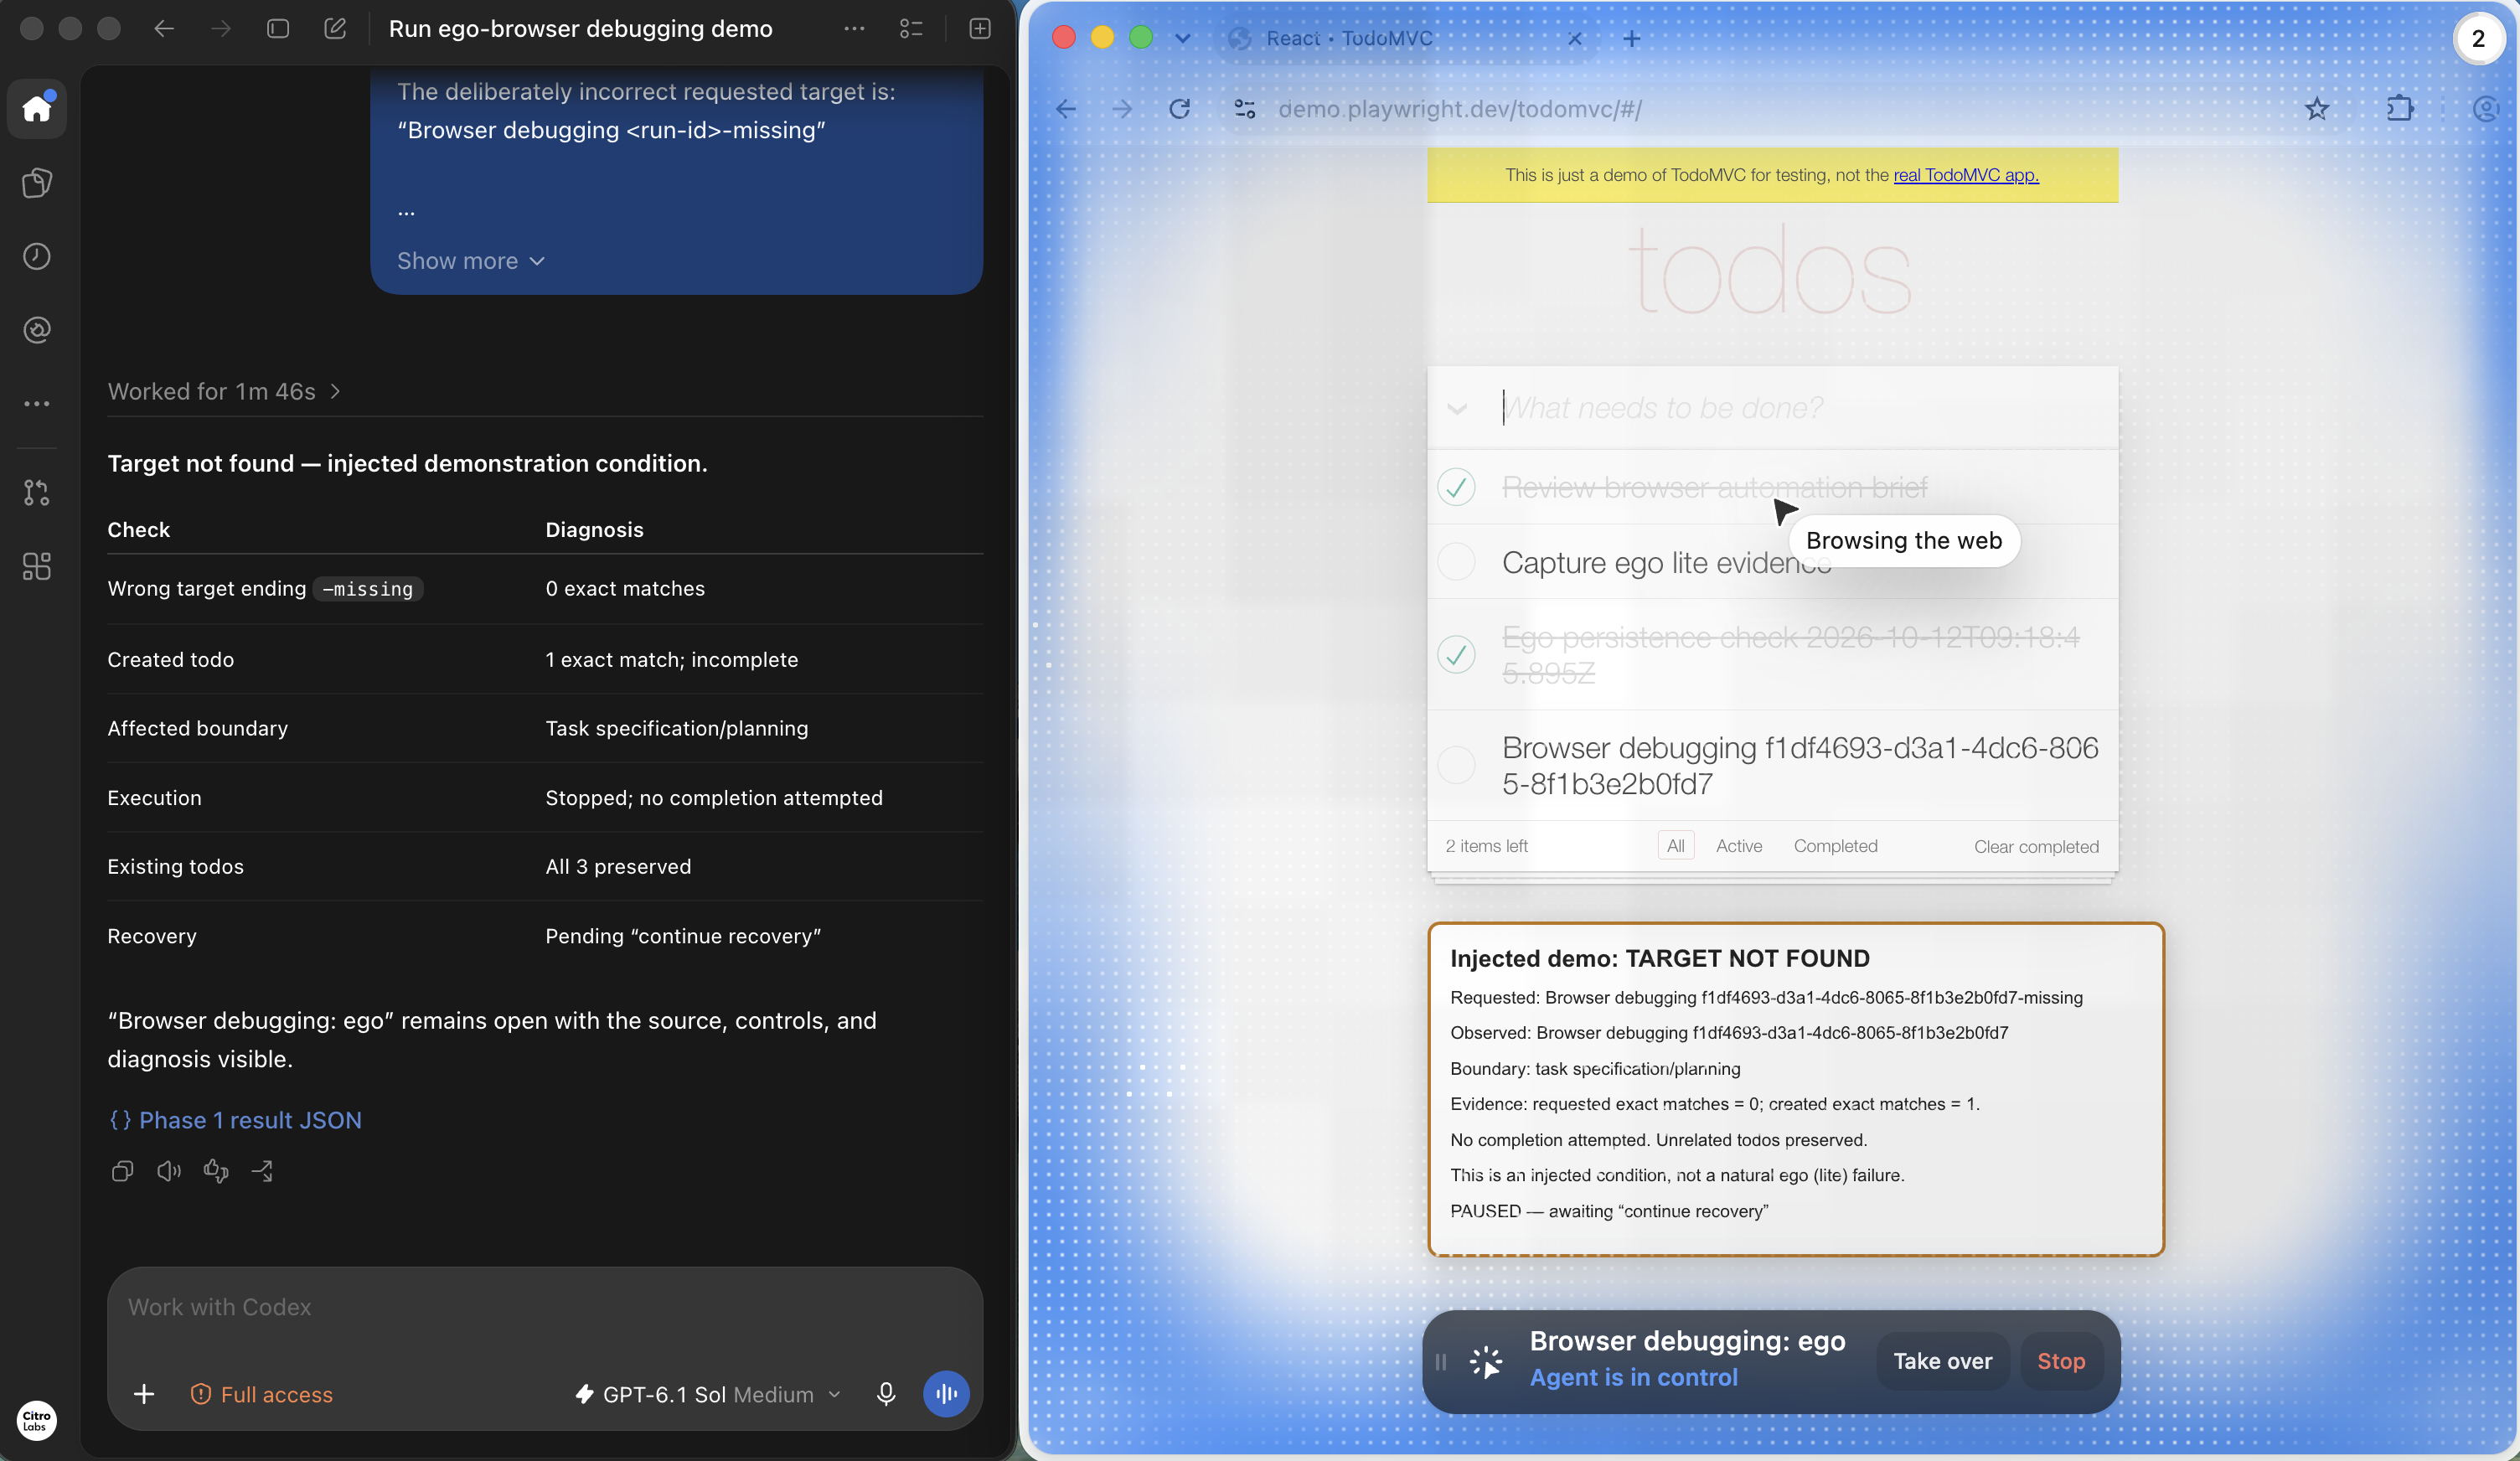
The supplied ego result records zero exact matches for the requested -missing target and one incomplete match for the newly created todo. The agent reports a task-specification/planning mismatch, leaves all three pre-existing todos unchanged and stops without attempting completion. A missing local guide path was resolved during setup using the installed helper. The orange diagnosis panel was added to the page DOM for this demonstration; it is an annotation, not a product-generated error message.
Open the full-resolution capture
Both supplied demonstrations end at the phase-one checkpoint. Recovery steps have not run, and completion after reload remains unverified. The next step is to confirm the intended exact target, act only on that item, reload and check its text and completed state again while rechecking unrelated items. These screenshots establish diagnosis and a visible pause, not successful recovery or a comparison of tool reliability.
FAQ
Use these answers to choose the next diagnostic step. A recovery should explain the observed failure and verify the same outcome, not just produce a more confident message.
Should I change the model first?
Only when evidence points to the decision layer. Wrong tabs, unavailable tools and rejected saves can fail independently of the model. Capture the first divergence before changing several variables.
How do I tell a stale observation from a bad plan?
Inspect the state supplied to the planner. If it lacks the current record or page, investigate observation. If it contains the right state but the chosen action contradicts the task, investigate planning.
Does a successful click mean the task succeeded?
No. It establishes an action at the browser boundary. The application may reject, defer or lose the change. Read the exact target again and check the required outcome.
Why did requestfailed miss a server error?
Because an HTTP error response can complete normally at the transport layer. Record relevant response statuses as well as transport failures, then associate them with the task action.
Can I solve a locator timeout by forcing the click?
First inspect the target, overlay and locator scope. Forcing an action can suppress helpful readiness checks while leaving the underlying problem intact. Use a fix that explains the failure.
What should a minimal incident record contain?
Task contract, URL and record identity, observation, chosen action, actual result and last confirmed state. Add versions, relevant errors, fresh verification and the retry history when available.
Are screenshots enough to diagnose every failure?
No. They show a visible state at a moment. Pair them with the observation supplied to the agent, action evidence and relevant application responses when diagnosing persistence or timing problems.
Can I open every browser trace in Playwright Trace Viewer?
No. The viewer expects Playwright's trace format. Check the producing tool's documentation; Chrome Trace Event JSON and agent execution traces need their appropriate viewers or analysis tools.
When should an agent stop retrying?
At the predefined limit, an unresolved identity or access boundary, or an uncertain side effect that cannot be checked. Report the checkpoint and missing evidence so a person can resume safely.
How does ego (lite) help with debugging?
It provides a visible browser workspace and agent connection for inspecting current state and handing over an authorized step. It complements logs and verification rather than supplying a complete root-cause diagnosis by itself.
Related reading
These guides cover completion evidence, browser permissions and the connection to an existing session. Use them when the incident points to one of those boundaries.