
The best one-line answer to this comparison already exists, from developer educator Steve Kinney: "Playwright drives. Chrome DevTools debugs. Pick on the verb, not the brand."
That's genuinely the whole decision. What's left is knowing which of your tasks are driving and which are debugging, because a few (like "check why this page is slow after login") look like one and are actually the other.
Here's the split with specifics: what each MCP uniquely owns, the numbers behind the token difference, how to run both without bloating your context, and the one capability neither has.
What's the actual division of labor?
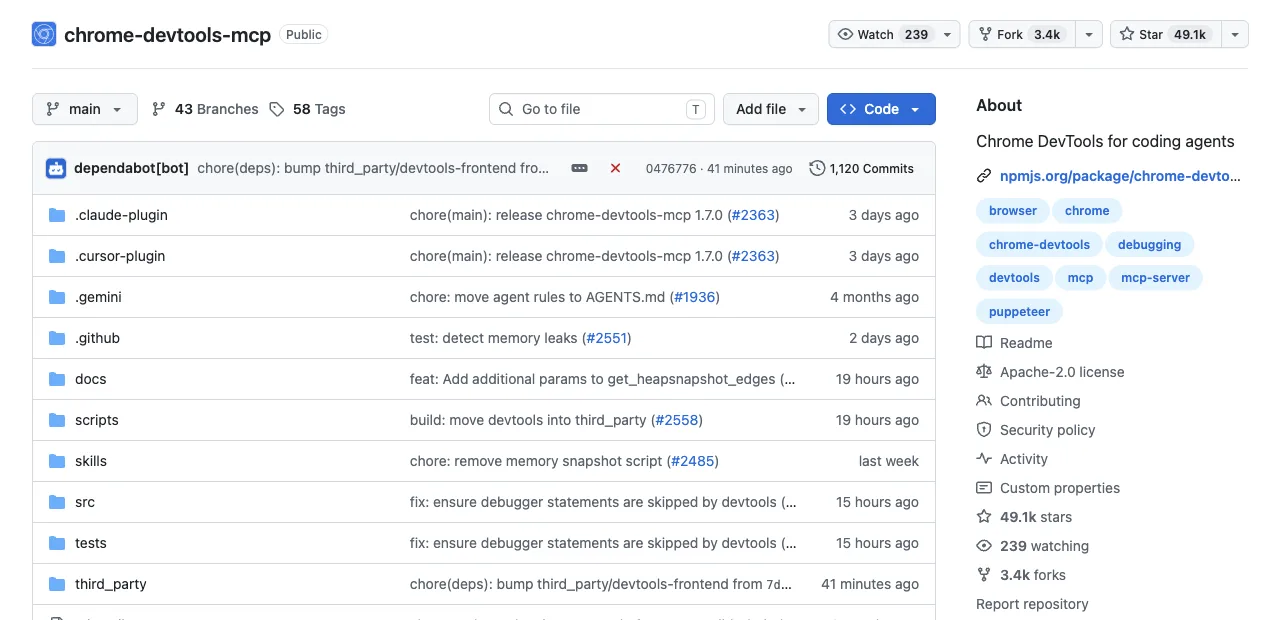
Both are official, free MCP servers that let your agent control Chrome. The design centers differ: Chrome DevTools MCP (shipped by Google, public preview September 2025, now at v0.21) wraps the DevTools protocol's diagnostic surface, while Playwright MCP wraps Playwright's operation surface. Read the table by task, not by product loyalty.
| Your task | Use | Why |
|---|---|---|
| Why is this page slow? (LCP, INP, CLS) | DevTools MCP | Performance tracing is its exclusive; Playwright MCP has no profiling at all |
| Find the memory leak / inspect console errors | DevTools MCP | Heap snapshots and source-mapped console are DevTools-panel features |
| Fill forms, navigate flows, scrape a list | Playwright MCP | Accessibility-tree refs make repeated operations deterministic |
| Test on Firefox, WebKit, or Edge | Playwright MCP | DevTools MCP is Chrome-only by construction |
| Daily tasks on your logged-in accounts, without losing your window | Neither, cleanly | See the last section; this is the gap both leave open |
Verb first, brand second, every time.
One more framing note before the details: both servers are free and officially maintained, so this isn't a budget decision. The only real cost of choosing wrong is context, because every registered tool schema and every response payload lands in your agent's window, and the two servers spend that budget very differently.
Which debugging tasks does DevTools MCP own?
Three examples where DevTools MCP does things Playwright MCP simply has no tools for.
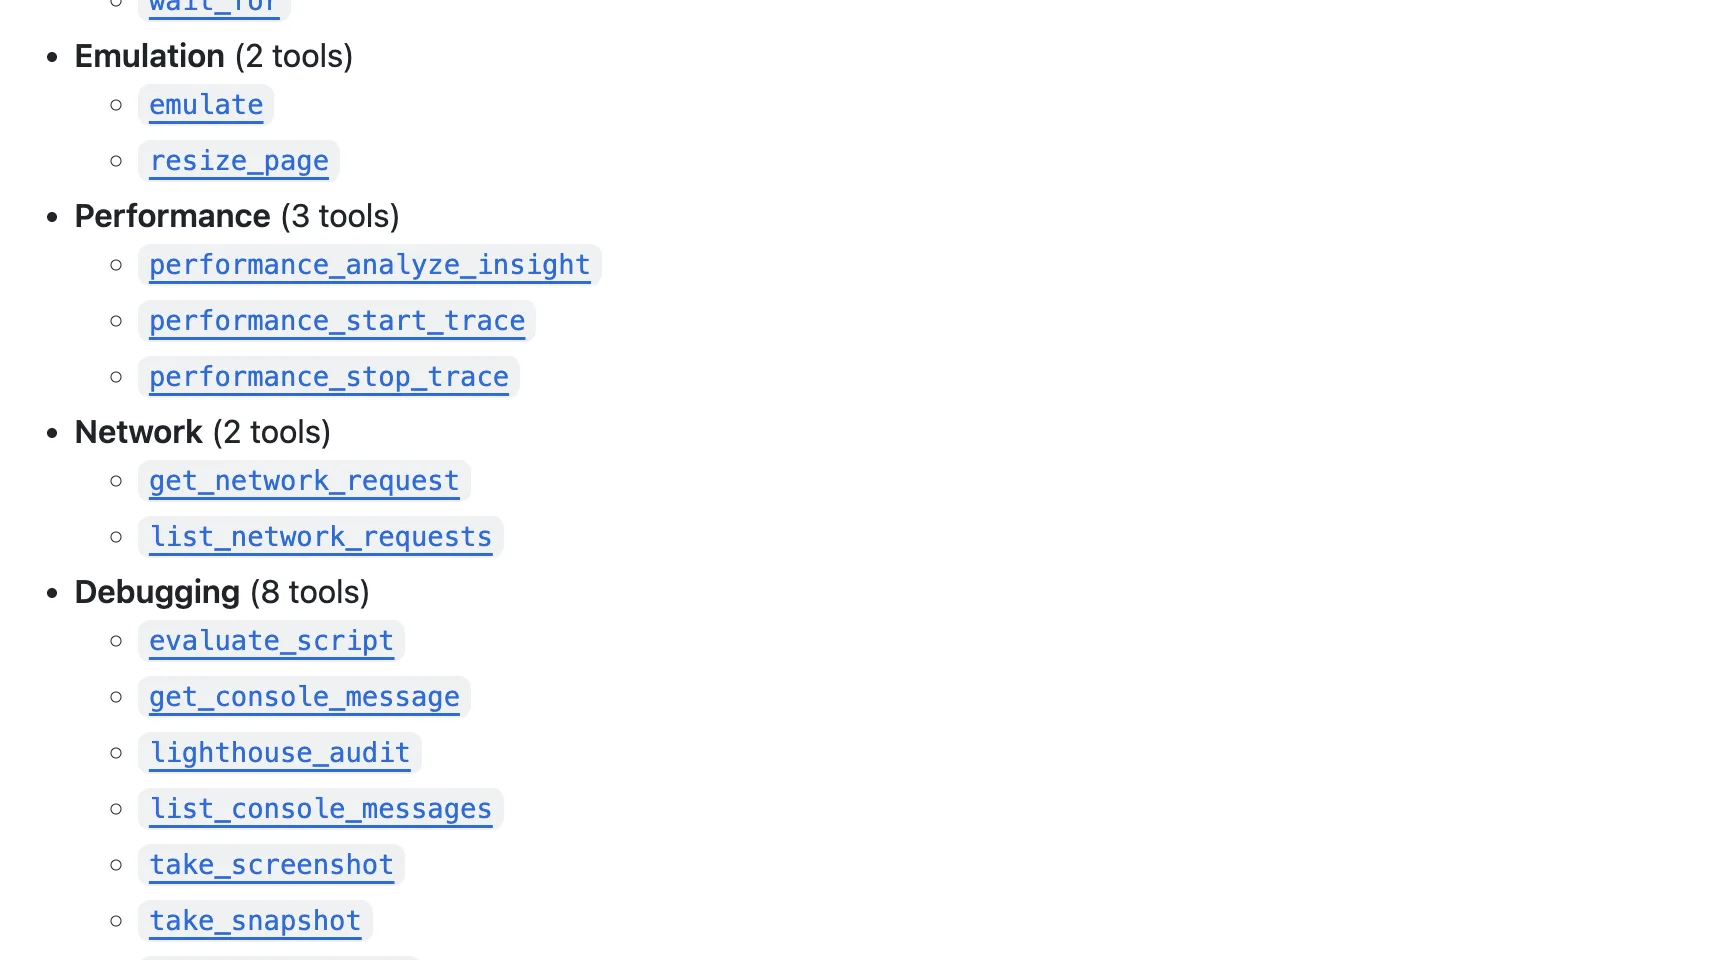
1. Performance investigation. performance_start_trace and performance_stop_trace capture a real trace with Core Web Vitals (LCP, INP, CLS), and performance_analyze_insight drills into named findings like LCPBreakdown, the same engine as the DevTools Performance panel. Your agent can answer "what exactly is delaying LCP" with data, not guesses.
2. Memory leaks. take_memory_snapshot produces standard V8 .heapsnapshot files, and v0.21 added a memory-leak-debugging skill on top. Nothing in Playwright MCP's toolbox touches heap analysis.
3. Network forensics and emulation. Requests stay inspectable across the last 3 navigations, large response bodies spill to disk instead of into your context, and a single emulate tool covers CPU throttling, network presets from Slow 3G to offline, viewports, user agents, and color scheme. "Does checkout survive a flaky connection on a mid-range phone" becomes one prompt.
One boundary to know: its lighthouse_audit covers accessibility, SEO, and best practices, and explicitly excludes performance scoring; traces are the performance path.
Which driving tasks does Playwright MCP own?
Three examples in the other direction, plus the token numbers that come with them.
1. Deterministic multi-step operation. Snapshots label every element with a stable ref (ref=e5), so "fill the shipping form and submit" resolves to exact targets, repeatably. This is the mechanism DevTools MCP's input tools don't provide with the same rigor.
2. Cross-browser flows. --browser=firefox, webkit, or msedge runs the same task across engines. DevTools MCP supports Chrome and Chrome for Testing, full stop.
3. State setup for tests. Storage state save and restore lets an agent bottle a session and reuse it across runs, plus browser_run_code as an escape hatch into raw Playwright when a task outgrows the tool menu.
The token asymmetry runs through everything: the February 2026 three-tool test put it as DevTools MCP returning targeted responses while "Playwright sends everything." Playwright MCP's full-snapshot habit is what makes it deterministic, and also what makes long sessions expensive; if that's your pain, the token problem breakdown covers the escape routes.
Here's that cost measured directly instead of quoted secondhand: a real take_snapshot call, run today through the actual mcp Python SDK against chrome-devtools-mcp@latest, against a plain logged-out page (Hacker News' front page, about 30 links).
await session.call_tool("take_snapshot", {})

navigate_page chars: 123
take_snapshot chars: 38285
## Latest page snapshot
uid=1_0 RootWebArea "Hacker News" url="https://news.ycombinator.com/"
  uid=1_1 link url="https://news.ycombinator.com/"
  uid=1_2 link "Hacker News" url="https://news.ycombinator.com/news"
    uid=1_3 StaticText "Hacker News"
  uid=1_4 link "new" url="https://news.ycombinator.com/newest"
    uid=1_5 StaticText "new"
  uid=1_6 StaticText " | "
  uid=1_7 link "past" url="https://news.ycombinator.com/front"
    uid=1_8 StaticText "past"
  uid=1_9 StaticText " | "
  uid=1_10 link "comments" url="https://news.ycombinator.com/newcomments"
    uid=1_11 StaticText "comments"
  uid=1_12 StaticText " | "
  uid=1_13 link "ask" url="https://news.ycombinator.com/ask"
...
38,285 characters, roughly 9-10K tokens, for one snapshot of a simple page. That's the same full-accessibility-tree mechanism Playwright MCP's snapshot leans on for its own refs, which is why the size argument in this article isn't a vendor claim, it's what the format costs by construction. For comparison, a targeted extraction of the same page (raw Playwright, no MCP layer, run minutes apart the same day) came back at about 140 characters:
{'title': 'Hacker News', 'url': 'https://news.ycombinator.com/', 'topStory': 'Qwen 3.8 27B', 'points': '414 points'}
elapsed_s: 1.8
Can you run both at once?
Yes, and lean is the way. Install both:
claude mcp add playwright -- npx @playwright/mcp@latest
claude mcp add chrome-devtools -- npx chrome-devtools-mcp@latest
Then control the context cost: DevTools MCP's --slim flag cuts it to 3 tools until you need the full diagnostic kit, and Playwright MCP's --caps flag gates optional tool groups (vision, pdf, devtools) behind opt-in.
Kinney's recommendation matches what we'd give: keep both configured but disabled by default, enable per task, "it's cheaper than being wrong." A sensible default is Playwright MCP for the driving work, switching to DevTools MCP when a task turns into a performance trace or a Lighthouse pass.
The masquerading tasks are where this pays off. "Check why the dashboard feels slow after login" reads like a driving task (navigate, log in, click around), and its payload is a debugging task (trace, then read the LCP breakdown). Run the navigation legs on whichever tool holds the session, then hand the diagnosis to DevTools MCP; splitting one prompt into those two legs is usually the difference between an answer and an afternoon.
What can neither of them give you?
An independent agent browser that carries your logged-in sessions. Playwright MCP launches its own fresh-profile browser: separate window, no cookies. DevTools MCP added --autoConnect (Chrome 144+), which attaches the agent to your current signed-in Chrome, but that puts human and agent in the same window, taking turns.
ego (lite) covers exactly that combination. It's an agent browser for browser automation: a free browser built for sharing your logged-in browser state with AI agents like Claude Code and Codex. Every site you've signed into stays signed in, the agent inherits that state, and it works in its own Space, an isolated workspace with its own tabs, so your window stays yours and multiple tasks run in parallel without colliding.
Any agent that can run a shell command drives it through the ego-browser skill, with whole workflows executing outside the model's context.
And the shortcoming, stated plainly: ego (lite) has no debugging panel. No performance traces, no heap snapshots, no Lighthouse. If your task is diagnosis, DevTools MCP keeps that job; ego (lite) takes the daily logged-in operation work the two MCPs weren't shaped for.
See ego (lite) vs Playwright MCP in detail, or download ego (lite) for Mac and keep both MCPs for what they're best at. Free.
FAQ
Is Chrome DevTools MCP better than Playwright MCP?
Neither is better; they're split by job. DevTools MCP is the only one with performance traces, heap snapshots, and emulation; Playwright MCP is the only one with cross-browser support and deterministic operation refs. Most setups that need one eventually configure both.
Which uses fewer tokens?
DevTools MCP, generally: it returns targeted responses and writes large network bodies to disk, while Playwright MCP attaches full accessibility snapshots that reach 50K+ tokens on complex pages. Playwright MCP's --snapshot-mode and filename options narrow the gap if you configure them.
Can Chrome DevTools MCP use my logged-in browser?
Yes, via --autoConnect on Chrome 144+, which attaches the agent to the Chrome you're signed into. The cost is shared ownership: agent and human operate the same window, so it suits debugging sessions better than background tasks. For logged-in tasks that shouldn't occupy your window, an isolated shared-state browser like ego (lite) is the fit.
Do they work with agents besides Claude Code?
Both are standard MCP servers, so Cursor, Codex, VS Code, and any MCP client can run them; swap the claude mcp add command for your client's config format.
If I only write tests, do I need DevTools MCP at all?
Not on day one: Playwright MCP plus your test framework covers authoring and running. It earns its slot the first time a test fails for a non-functional reason, a slow LCP, a memory creep, a request that only breaks on Slow 3G, because those diagnoses have no Playwright MCP tool. Install it lean with --slim and enable it when that day comes.